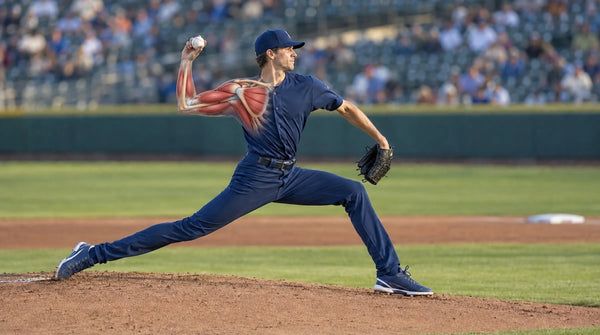
Does Lower-Body Strength Increase Pitch Velocity?
What the research shows about the legs, what it shows about getting stronger, and why those are two different questions.
A Coach’s Preparation Guide from Oates Specialties | Part of: From Fall to Opening Day
This guide is updated as relevant research becomes available.
Executive Summary
Pitchers use their legs, and faster pitchers often show different lower-body forces, muscle size, and test results than slower ones. Both statements are well supported.
The question coaches actually ask is different: if a pitcher gets stronger in his legs, will he throw harder? In isolation, the research cannot confirm that. In a systematic review of 16 training studies in baseball players, eight programs raised throwing velocity more than a comparison group, and none of those eight was a lower-body-focused strength or power program. Programs that included squats, jump squats, or leg work did not beat their comparison groups. And when researchers changed how pitchers used their legs, leg forces changed and velocity went down.
None of that makes leg strength unimportant. As one part of a complete program, it may give a pitcher more capacity to produce force, and to keep producing it for longer. That is a reasonable expectation, but it has not been proven.
Oates Specialties’ position. Because the research conflicts, we believe coaches should keep lower-body strength work in their programming in the general sense, unless an athlete is seeing performance declines or injuries from that work. Judge it by what happens on the mound, not the weight-room number. Appendix D, the Lower-Body Transfer Check, tracks it.
Find Your Answer
Answer the question closest to what you need right now, and jump straight there.
- “Does lower-body strength actually raise pitch velocity? I want the short answer.” → Jump to: 2. The Short Answer
- “Faster pitchers show different lower-body numbers. Doesn’t that mean stronger legs make them faster?” → Jump to: 3. The Claim Has Three Parts
- “What has the research actually shown?” → Jump to: 4. What the Research Shows
- “If the proof isn’t there, should leg strength still stay in the plan?” → Jump to: 5. Why Capacity Still Belongs in the Plan
- “How do I tell whether leg work is reaching the mound?” → Jump to: 6. What a Coach Can Do With This
🎧 Prefer to listen? Audio version of this article:
1. The Coaching Situation
The Audit named a priority gap: the lowest-hanging fruit between a pitcher’s current floor and the ceiling his role demands. How Should Lifting and Throwing Fit Together? showed how to schedule the lifting. This guide asks the question that follows: when the gap is lower-body or trunk capacity, does getting stronger there make a pitcher throw harder?
Baseball usually answers yes before anyone defines “stronger.” Our hitting guides argue that strength sets a ceiling on the force a hitter has to work with. Pitching research adds that more force is not automatically better, that timing matters as much as amount, and that the step from the weight room to the ball is where the question gets hard.
2. The Short Answer
Keep lower-body strength in the plan as part of general preparation. Judge it by what happens on the mound.
Three findings support that. Lower-body qualities go with velocity in groups of pitchers, though which quality matters varies. In one simulated-game study, declines in hip strength went with late-outing velocity loss. And in one experiment, changing how pitchers used their legs changed energy flow and velocity, so the legs matter to the pitch.
When a coach sees a stronger squat and no change on the radar gun, that is not proof the training failed: the capacity may not yet be organized into the pitch, or strength may not have been that pitcher’s limitation.
3. The Claim Has Three Parts
Arguments about legs and velocity mix three claims. Separating them is the most useful thing a coach can do with this topic.
Participation. Pitchers use their legs during the delivery. Well established.
Association. Faster pitchers, as a group, often show different lower-body forces, movements, muscle size, or test results. Supported, but which measure lines up with velocity changes from one study to the next.
Causation. Making a pitcher’s legs stronger makes him throw faster. Not shown in a controlled study.
4. What the Research Shows
Faster pitchers look different, in inconsistent ways. Reviews of observational work link hip strength, hip range of motion, stride length, lead-knee movement, and pelvis and trunk position to velocity. In high school pitchers, lower-leg and thigh muscle volume lined up with velocity, while trunk muscle volume did not. In Division I pitchers, body mass was the strongest single predictor of velocity, so a power score is partly a size score. Tests disagree from group to group: jump force but not jump height in junior high pitchers, cycling power but not the countermovement jump in minor leaguers, a rotational medicine-ball throw but not jumps in Division III players, a lateral jump in one college group. No single lower-body test tracks velocity reliably, so predicting mound results from one jump or one lift leans on that number harder than the research does. That is why the Audit treats its broad jump and rotational medicine-ball throw as baselines to repeat, not predictors.
Ground force is not strength. Strength is how much force an athlete can produce on a test. Ground force is the push exchanged with the ground during the pitch. A pitcher can get stronger without changing how he pushes on the mound, change how he pushes without getting stronger, or throw harder because his timing improved while his strength stayed the same. In 174 pitchers averaging about 17, greater drive-leg impulse went with lower velocity across the whole group, though not within subgroups. In 105 high-velocity pitchers, lead-leg braking force related to velocity only during a specific window after the front foot landed. When the force happened mattered more than how much there was. Force during the pitch is a skill as well as a capacity: the weight room builds the capacity but cannot by itself teach the timing.
Changing the legs changed the pitch. In one experiment, 20 college pitchers threw with a normal stride, a stride 20 percent shorter, and one 20 percent longer. Leg forces changed in both directions, but the energy passed from the pelvis to the trunk did not change significantly, and velocity dropped from about 76 to about 73 miles per hour in both altered conditions. More energy from the back hip did not produce a faster pitch. Limits: flat ground in a lab, forced extreme changes, one session, no best stride identified. The Leg Nobody Thinks About covers stride mechanics.
Training studies have not isolated the legs. In the systematic review of 16 training studies (679 players), 12 compared a training group against a comparison group with statistics, and eight showed a greater velocity gain with training. Those eight used weighted balls, upper-body plyometrics, shoulder strengthening, and resisted throwing. The studies that included lower-body work did not beat their comparison groups: a jump-squat program, a squat, leg-extension, leg-curl, and sprint program. A squat circuit showed no significant velocity change. One six-week whole-body study improved velocity in the trained group but reported no statistical comparison. The closest direct test of leg training, a randomized four-week in-season trial in 30 high school pitchers, used jumps, hops, goblet squats, and kettlebell work. All three groups improved in strength, jumping, balance, and velocity. But every pitcher trained and was also pitching, so velocity rose during the program without showing the legs raised it. Programs aimed at the pelvis and trunk have fared better: a seven-week randomized trial in 46 college throwers and an eight-week controlled study in 54 high school pitchers each found greater velocity gains than their comparison groups. The first compared against an endurance program; in the second, pitching mechanics did not differ between groups and elbow load rose along with ball speed. Neither isolated the legs. No study has traced the full chain from stronger legs to different ground forces to a faster ball.
Holding velocity is a separate question. In a simulated nine-inning outing, 18 college pitchers threw slower in the seventh and ninth innings, and their hip strength was lower after pitching. Those whose hip-adduction strength dropped most tended to lose the most velocity. That links lower-body fatigue to velocity loss; whether tired hips caused it, or stronger hips would have prevented it, is unknown.
5. Why Capacity Still Belongs in the Plan
A delivery asks the legs and hips to produce and absorb force dozens of times in an outing, then again days later. Our reasoning is that a pitcher with more lower-body capacity relative to that demand has more in reserve, including late in an outing. The fatigue finding in Section 4 fits that picture.
Research on how strength carries over to sport, drawn mostly from sprinting, points the same direction: transfer depends on how closely training matches the movement pattern and speed, and on coordination, while general strength keeps its own value. Our view is that lower-body strength has to be blended with work that practices organizing force before it can transfer to the mound. That blending is our reasoning, and no baseball study has tested it directly. It is why we suggest to keep general lower-body work in the plan, and why we encourage coaches check whether it reaches the mound.
6. What a Coach Can Do With This
These questions are an Oates Specialties suggestion, not a research-derived test.
1. What appears to be limited? Start with the Audit’s priority gap: general strength, fast force production, single-leg control, braking, holding up late in outings, or the pitching skill itself? These are different problems.
2. What measured it? The Audit’s battery, a squat, a jump, a force plate, a radar gun, and video each answer a different question. Do not use one to answer another’s.
3. What changed after training? Only the weight-room number, or also how the front leg lands and holds and how consistently the pitcher repeats his delivery?
4. Did it transfer? Repeat the Audit’s mound session at the mid-window checkpoint: is velocity higher, or held longer through the simulated innings, without losing command or slowing recovery?
If the weight room improves and the mound stays the same, that is useful information: the capacity may need more time, or strength may not have been that pitcher’s limitation. How Long Does It Take to Build Arm Strength? explains why different qualities run on different clocks. Hold or reduce the lower-body work if velocity, command, or recovery gets worse after it is added, or if pain or injury appears. Keep throwing present while capacity is built, as How Should Lifting and Throwing Fit Together? explains. For examples of general lower-body strength work, see Baseball Preparation: Essential Bodyweight Exercises on the Oates Education Hub.
7. Practitioner Lens
Practitioner lens: applied interpretation, not peer-reviewed proof. These coaches have published positions that help organize a decision research has not settled. Their views do not prove that a method produces an outcome.
Ron Wolforth has argued that velocity belongs inside a complete development plan, alongside command, recovery, durability, and consistency, rather than becoming the only goal. He has also written that weight-room focus has drifted toward size, mass, and power at the expense of agility, balance, motor control, and mobility, producing athletes who are strong but lack the coordination healthy throwing needs.
Randy Sullivan, a physical therapist and certified strength and conditioning specialist, uses force-plate testing in his facility. His published work emphasizes that producing force is only part of the problem, and that how the athlete uses force through the delivery, including the front side, matters as much. He has cautioned that a greater push off the rubber does not automatically mean greater velocity, which lines up with the research in Section 4.
Where they overlap. Neither treats a lift number, a jump score, or body weight as the explanation for velocity. Both place lower-body strength inside a larger system.
What this cannot establish. Neither framework has been tested against an alternative in a controlled trial.
Commercial transparency. Ron Wolforth and Randy Sullivan operate commercial training businesses. Wolforth and Sullivan use Oates Specialties’ products in their facilities and have commercial relationships with Oates Specialties. Their frameworks, proprietary measurement systems, and product use appear here as examples of applied reasoning, not as independent scientific validation or proof that a method or product improves velocity.
8. Tools That Challenge the Body
None of these products has been shown to increase pitch velocity, and we do not claim they do. What they can do is challenge the body to build general lower-body strength and, in the Donley Hip Spin’s case, give the athlete a way to work on the timing and sequencing of the lower half. The research below supports those tasks. It does not test these products, and none of it involved pitchers using them.
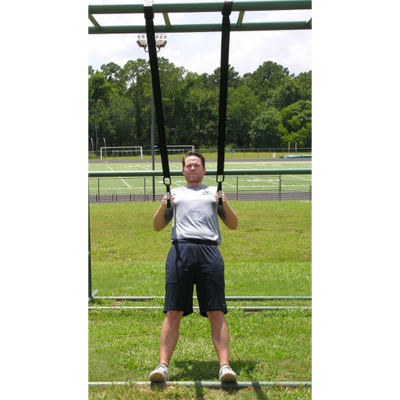
General strength base: TAP® Suspension Trainer. General strength is what we advocate, and the Suspension Trainer is a good way to build it. Body weight and strap angle scale the resistance, so one setup can train bilateral strength (squats, rows), unilateral strength (split squats, single-leg squats, lunges), and endurance (higher repetitions), matched to the athlete without plates. In a 12-week randomized trial in untrained older adults, suspension and traditional training produced similar gains in leg-extension strength and muscle size, and in an eight-week trial of 25 young volleyball players, jump height and power improved more with suspension than with dumbbells. Both were small and neither involved pitchers. Boundary: suspension training is still resistance training, with the same soreness and fatigue cost, and no study shows it raises velocity.
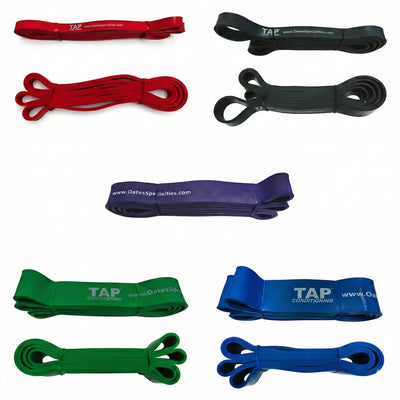
General strength: Exercise Bands and TAP® Giant Flat Bands. Elastic resistance rises as the band stretches, which makes it a low-load way to build bilateral strength, unilateral strength, and endurance in the hips and legs. The Giant Flat Bands are 41-inch loops in five resistance levels that support squats, deadlifts, lateral walks, lunges, and anchored jumps and pulls. The TAP® Exercise Bands are 9-inch loop bands that go around the ankles that supports banded walks, side laterals, side lying clams, and other hip abduction/adduction exercises. A meta-analysis of eight studies found lower-limb strength gains with elastic resistance were similar to those with conventional equipment, and a meta-analysis of 21 team-sport studies found that adding band training improved jump, sprint, and change-of-direction results over routine training alone. Protocols varied widely, bands differ by manufacturer, and no baseball studies were included. Boundary: bands can build general strength; they are not shown to change pitch velocity. The studies measured strength, jumping, and sprinting, so using bands for endurance is a coaching application, not a research finding.
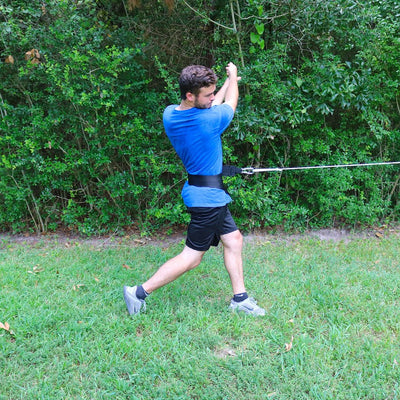
Timing and sequencing of the lower half: Donley Hip Spin. We see the Hip Spin as a bridge between the weight room and the mound: strength built in the weight room still has to be organized into the turn of the pitch. The belt attaches a band to the pelvis so a partner or anchor can assist or resist hip rotation during drills. That bridge role is our reasoning, and this is the product with the thinnest support. What the research does show: timing, not raw speed, is what relates to velocity (in two samples, peak pelvis rotation speed alone did not, while in a small group of skilled pitchers the gap between peak pelvis and peak trunk rotation did); the gluteal muscles work at or above maximal voluntary effort from stride through arm cocking in high school pitchers and track how fast the pelvis rotates; and the pelvis-and-trunk programs described in Section 4 beat their comparison groups. Most of that is association or small-sample work, and none of those programs used this belt. Boundary: a rotation task that makes timing and control visible and gives the athlete a way to practice them, not a velocity fix and not a pelvic-speed trainer. Athletes with hip, spine, or groin problems should use it only under qualified professional direction.
9. Athlete Action and Parent Note
Pitchers. Getting stronger is useful and is one part of a faster fastball. Keep throwing while you build strength, because strength you never practice in your delivery has no way to reach the ball. Don’t chase a personal record at the cost of your throwing, and report sharp, unusual, or worsening pain instead of training through it.
Parents. Strength training can be a useful part of preparation. Be cautious of any program that guarantees miles per hour from leg work alone, and make the athlete’s full week visible to the coach, including outside lessons, extra lifting, and showcases.
10. Safety and Scope
This guide does not diagnose a hip, knee, back, shoulder, or elbow problem, identify the cause of pain, prescribe rehabilitation, or determine medical readiness. Persistent, sharp, unusual, worsening, or function-limiting pain belongs with a qualified professional, as do numbness, tingling, weakness, catching, or locking. Existing restrictions and qualified-professional guidance lead the plan when they apply.
Introduce unfamiliar movements and loads under supervision, start below an assumed maximum, and progress only as the athlete’s response supports it. Coaches ask, record, monitor, adjust, coordinate, and refer; qualified professionals evaluate, diagnose, and clear.
11. Where This Guide Fits in the Series
This guide owns one question: whether lower-body strength raises pitch velocity, and how to tell if lower-body work is reaching the mound. It sits in the Build section of How to Build a Fall Pitching Program. The Audit finds the priority gap, How Long Does It Take to Build Arm Strength? says how fast it can change, and How Should Lifting and Throwing Fit Together? schedules the work.
12. What the Evidence Has Not Answered
No controlled study has trained only the legs and measured pitch velocity against an untrained group; the closest programs also trained the core and trunk. No study has traced the full chain from stronger legs to changed mound forces to a faster ball. No lower-body test reliably predicts velocity across studies. No study has shown that stronger legs prevent late-outing velocity loss. And none of the equipment above has been tested for its effect on pitching; the Donley Hip Spin has the thinnest support of these tools.
A coach still has to plan. These gaps are a reason to judge lower-body work on the mound, not a reason to stop doing it.
Evidence and Sources:
Appendix A: How to Read This Research
Observational studies compare pitchers to other pitchers. They show what goes together. They cannot show what causes what.
Within-pitcher experiments change something about the same pitcher’s delivery and measure the result. They show how organization affects force and velocity in one session. They do not show long-term training effects.
Training studies with a comparison group are the only kind that can test whether a program raises velocity. Their value depends on whether the comparison group was real and whether throwing was held equal between groups.
A change inside one group is not proof. If a training group improves but there is no untrained group, the change could come from pitching, practice, growth, or getting used to the test.
Most evidence here comes from male baseball players from junior high through the minor leagues. It may not apply to younger athletes, female athletes, or softball players.
Appendix B: Study Details
Full citations, links, and verification status for each study appear in the Annotated Bibliography.
Lower-body factors across adult pitchers (Manzi 2023)
Population and design. Systematic review of 17 observational studies involving 909 adult baseball pitchers.
Finding. Hip strength, hip range of motion, stride-related variables, lead-knee movement, and pelvis and trunk positions were among the lower-body factors associated with pitch velocity.
Limits. Observational studies only. Does not show that changing any factor raises velocity.
Muscle volume in high school pitchers (Yamada 2013)
Population and design. 47 male high school pitchers, average age 16.2 years. Muscle volume estimated by segmental bioelectrical impedance calibrated against MRI. Velocity measured by radar.
Finding. Whole-body muscle volume correlated with velocity at r = 0.41. Both lower legs, the dominant thigh, and the dominant arm segments correlated with velocity. Trunk volume did not. Results were not affected by age or years of experience.
Limits. Cross-sectional. The authors concluded that muscle mass contributes to velocity only to a limited degree.
Lower-body power and body mass in Division I pitchers (King 2025)
Population and design. 33 Division I pitchers tested with force-plate jumps and cycling, with in-game fastball velocity collected by a TrackMan tracking system. The abstract reports body mass as the strongest predictor of peak fastball velocity (r = 0.58). Unverified here: a reviewer reports absolute jump peak power also predicted velocity while jump height and relative power did not; confirm against the abstract.
Finding. Absolute peak lower-body power was associated with fastball velocity. Body mass was the strongest individual predictor.
Limits. Observational. Does not show that adding mass or power raises velocity.
Jump force in junior high pitchers (Hsiao and Lee 2026)
Population and design. 32 adolescent male junior high pitchers tested with countermovement jumps on force plates.
Finding. Several absolute jump force measures were associated with fastball velocity. Absolute braking force and height together explained 43.3 percent of the variation. Jump height and body-size-adjusted measures were not associated.
Limits. Small cross-sectional sample. Does not create a screening cutoff.
Jump and cycling power in professional pitchers (Donahue 2018)
Population and design. 27 minor league pitchers tested with countermovement jumps and a 30-second sprint cycling test.
Finding. Countermovement jump measures were not significantly related to velocity. Average cycling power was, at r = 0.44 with peak velocity and r = 0.43 with average velocity.
Limits. Small cross-sectional sample.
Whole-body power tests in Division III players (Taniyama 2021)
Population and design. Division III college baseball players tested with a rotational medicine-ball throw, a standing broad jump, and a lateral jump.
Finding. Rotational medicine-ball throw velocity correlated with pitching velocity at r = 0.62, explaining 38 percent of the variation. Neither jump test was significantly related to pitching velocity.
Limits. Small descriptive study. The medicine-ball throw is a whole-body task, not a lower-body test.
Lateral jump in college players (Lehman 2013)
Population and design. 42 male college baseball players, not limited to pitchers.
Finding. Lateral-to-medial jump performance was associated with throwing velocity.
Limits. Position players included. This finding was not repeated in the Division III study above.
Drive-leg impulse (Glover 2025)
Population and design. Retrospective case series of 174 pitchers averaging 17.0 years old, across youth, high school, and elite levels, throwing 613 fastballs.
Finding. Greater drive-leg impulse was associated with lower velocity across the full group. The relationship was not retained in subgroup analyses. Drive-leg slope was not related to velocity.
Limits. Retrospective and observational. Does not mean pitchers should produce less force.
Timing of lead-leg braking (Wasserberger 2025)
Population and design. 105 high-velocity pitchers throwing on force plates.
Finding. Lead-leg braking force during a specific window after front-foot contact was associated with velocity.
Limits. Observational. Does not show that training braking force raises velocity.
Changing stride length in the same pitchers (Matsuda 2025)
Population and design. 20 male college pitchers, average age 19.9. Each threw with normal stride, a stride 20 percent shorter, and a stride 20 percent longer, in random order a week apart, on flat-ground force plates to a target 16 meters away.
Finding. A longer stride increased energy flow from the back hip into the pelvis. Total energy flow from the pelvis to the trunk did not differ significantly across strides. Velocity averaged 33.9 meters per second with normal stride and 32.5 with both shorter and longer strides. Normal stride was significantly faster than either change.
Limits. Laboratory flat-ground throwing, not a mound. Forced, extreme stride changes in one session. Does not identify a best stride.
Hip fatigue and velocity across an outing (Yanagisawa and Taniguchi 2018)
Population and design. 18 collegiate pitchers in a simulated nine-inning game.
Finding. Mean fastball velocity was lower in the seventh and ninth innings than in the first. Hip abduction and adduction strength were lower after pitching. A larger drop in hip adduction strength was associated with a larger ninth-inning velocity drop.
Limits. Small, single simulated game. Does not show that hip training preserves velocity.
Resistance training and throwing velocity (Zhang 2023)
Population and design. Systematic review of 16 two-arm or multi-arm training studies in baseball players, 679 participants in total.
Finding. Of 12 studies reporting between-group statistics, eight showed greater velocity gains with training than with comparison. The training groups in those eight most often gained about 2 to 4 miles per hour, and one older study reported about 8. None of those eight tested a lower-body-focused strength or power program; half used weighted balls. Studies including jump squats, squats, leg extensions, leg curls, or leg circuits did not beat their comparison groups. One 6-week study of high school players with whole-body programs, including lower-body work, reported within-group velocity gains and no gain in the untrained group, without a between-group statistical comparison.
Limits. Most included studies were of moderate quality, and none blinded participants or assessors.
Lower-body training in high school pitchers during the season (Kim 2024)
Population and design. 30 male high school pitchers, ages 16 to 19, randomized to compound, plyometric, or kettlebell training twice weekly for four weeks during the season. Assessors were blinded to group.
Finding. Strength, vertical jump, balance, and velocity improved in all three groups. In post hoc comparisons, the compound group improved significantly more than the plyometric and kettlebell groups.
Limits. No untrained comparison group, so velocity gains cannot be attributed to the training rather than in-season pitching. The authors noted limited confidence in their radar equipment. Four-week duration.
Studies behind the equipment tasks in Section 8
Suspension versus traditional training in older adults (Soligon 2020). Randomized trial, 42 untrained older adults, 12 weeks. Leg-extension strength rose about 15 percent with traditional training and about 18 percent with suspension training; muscle thickness and functional tests improved similarly. Limits. Older adults, not athletes; small groups.
Suspension versus dumbbell training in volleyball players (Ozdamar 2024). 25 young male volleyball players, eight weeks. Countermovement jump height rose 12.2 percent with suspension training versus 0.8 percent with dumbbells; jump power rose 9.6 percent versus no change. Limits. Small, male only, one sport; the abstract does not report the strength results.
Elastic versus conventional resistance (Lopes 2019). Meta-analysis of eight studies. Lower-limb strength gains were similar with elastic and conventional equipment (effect size values to be confirmed; the abstract was reportedly corrected by an erratum, SAGE Open Med. 2020;8:2050312120961220). Limits. Few studies and wide confidence intervals.
Band training in team sports (Stankovic 2025). Meta-analysis of 21 studies and 729 athletes, mostly handball. Adding band training improved jump (SMD 1.43), sprint, and change-of-direction results compared with routine training alone. Limits. Heterogeneous protocols, band stiffness varies by manufacturer, mostly 5 to 10 weeks, no baseball studies, no head-to-head comparison with other resistance methods.
Pelvis and thorax timing (van der Graaff 2016). Eight skilled pitchers. Peak pelvis and peak thorax rotation velocity were each unrelated to throwing velocity; the time between the two peaks was positively related. Limits. Conference abstract, very small sample, association only.
Torso and pelvis energy (Covarrubias 2023). 7,824 pitchers from youth to professional. Peak torso rotational kinetic energy related strongly to velocity (R-squared 0.65); peak pelvis rotation velocity did not (R-squared 0.00). Limits. Conference abstract, association only; two authors are affiliated with a commercial training company.
Gluteal activity and pelvis rotation (Oliver 2010). High school pitchers, surface EMG across the pitch. Preferred-side gluteus maximus activity exceeded 100 percent of maximal voluntary isometric contraction in all pitchers from stride through arm cocking, and gluteal activity related to the rate of pelvis rotation but not torso rotation. Limits. Single group, no training; sample size not available to us.
Lumbopelvic-hip strength training in high school pitchers (Oyama 2026). Controlled study, 54 high school pitchers, eight weeks. Ball speed increased more with the lumbopelvic-hip strength program than in controls. Changes in pitching kinematics were limited, with no between-group differences, and elbow varus moment increased. Within the trained group, larger gains in trunk-rotation strength and power went with a more closed pelvis at lead-foot contact, a smaller trunk-separation angle, and later peak upper-torso rotation. Limits. Abstract only; allocation method and limitations not available to us; a core-and-hip program, not leg strength alone.
Transfer of strength training to sport (Young 2006). Review using sprinting as its example. Exercises that matched the movement pattern and contraction speed transferred better; large power gains in nonspecific movements brought small sport gains; intermuscular coordination mattered for transfer; general strength training kept its value for body mass, soft-tissue injury risk, and core stability. Limits. Narrative review from sprinting, not pitching.
Proximal-segment power training (Palmer 2015). Randomized trial, 46 NCAA Division III athletes (29 baseball, 17 softball), seven weeks. A pelvis, spine, and trunk power-and-stability program improved peak throwing velocity (normalized to body weight) more than an endurance program, with larger gains in chop and lift power. Limits. Division III athletes, mixed sports, comparison was an endurance program, not no training; exercises and limitations were not available to us; the program was not lower-body strength work and did not use a hip belt.
Appendix C: Terms Used in This Guide
Association. Two measures that move together in a group. It does not show that changing one changes the other.
Braking force. Force that slows or redirects forward movement, especially through the front leg after it lands.
Causation. One thing producing a change in another.
Comparison group. Athletes in a study who do not get the training being tested, so the training’s effect can be separated from everything else.
Countermovement jump. A vertical jump that starts with a quick dip down before jumping.
Drive leg. The back leg, on the rubber at the start of the delivery.
Energy flow. How mechanical energy moves between body segments during a movement.
Ground force. The force exchanged between the athlete and the ground during a task.
Impulse. Force added up over the time it is applied.
Lead leg. The front leg, which strides toward home plate.
Power. How quickly force can be turned into movement.
Strength. How much force an athlete can produce on a given test.
Appendix D: The Lower-Body Transfer Check
Use this alongside the Audit to decide whether lower-body work is reaching the mound for one pitcher. It is a planning record, not a screening tool, a medical assessment, or a readiness score. Work down the table from what appears limited to whether the change reached the mound.
Athlete: ______________________________ Date: ______________
Coach or staff member: ______________________________
| Question | What to record | Notes |
|---|---|---|
| What appears limited? | Strength, fast force, single-leg control, braking, late-outing drop, or skill | |
| What measured it? | Test used and result | |
| What training was added? | Task, frequency, and start date | |
| What changed in the weight room? | Same test, retested | |
| What changed on the mound? | How the front leg lands and holds; repeatability | |
| Did it transfer? | Velocity, velocity late in outings, command, recovery | |
| Next decision | Hold, adjust, progress, or refer |
Stop and refer under the conditions Section 10 sets out. This worksheet is a planning record, not a substitute for that judgment.
Annotated Bibliography
Each source below was verified either against its full text or against its abstract and publisher or PubMed record, as noted in each entry. Appendix B gives the figures behind the summaries in the guide.
Association research
Manzi JE, Yu JS, Sudah SY, Wishman M, Quan T, Koo A, Kunze KN, Kew M, Carr JB, Fu M, Dines JS. A systematic review of lower-body kinematic and strength factors associated with pitch velocity in adult baseball pitchers. Journal of Sport Rehabilitation. 2023;32(4):440-448. doi:10.1123/jsr.2022-0059. https://pubmed.ncbi.nlm.nih.gov/36809769/ Why it matters here. The broadest summary of lower-body factors related to velocity in adults. Use with care. Observational studies only.
Yamada Y, Yamashita D, Yamamoto S, Matsui T, Seo K, Azuma Y, Kida Y, Morihara T, Kimura M. Whole-body and segmental muscle volume are associated with ball velocity in high school baseball pitchers. Open Access Journal of Sports Medicine. 2013;4:89-95. doi:10.2147/OAJSM.S42352. https://www.dovepress.com/whole-body-and-segmental-muscle-volume-are-associated-with-ball-veloci-peer-reviewed-fulltext-article-OAJSM Why it matters here. High school evidence that lower-leg and thigh muscle volume relate to velocity, with trunk volume unexpectedly not related. Use with care. Cross-sectional; muscle volume estimated, not directly imaged.
King BW, Snow TK, Millard-Stafford M. Peak lower-extremity power unadjusted for body mass predicts fastball velocity in collegiate baseball pitchers. Journal of Strength and Conditioning Research. 2025;39(2):217-226. doi:10.1519/JSC.0000000000004966. https://pubmed.ncbi.nlm.nih.gov/39446825/ Why it matters here. Shows body mass influences what a power score means. Use with care. Observational, 33 pitchers.
Hsiao H-W, Lee H-J. Countermovement jump analysis as a predictor of overhead pitching velocity in adolescent baseball pitchers. Journal of Human Kinetics. 2026;102:23-34. doi:10.5114/jhk/211720. https://pmc.ncbi.nlm.nih.gov/articles/PMC13215227/ Why it matters here. Separates jump force from jump height in junior high pitchers. Use with care. Small cross-sectional sample.
Donahue PT, Beiser E, Wilson SJ, Hill CM, Garner JC. The relationship between measures of lower body power and pitching velocity in professional baseball pitchers. Journal of Trainology. 2018;7(2):24-27. https://www.jstage.jst.go.jp/article/trainology/7/2/7_24/_article Why it matters here. In professionals, the countermovement jump did not relate to velocity while cycling power did. Use with care. 27 pitchers.
Taniyama D, Matsuno J, Yoshida K, Pyle B, Nyland J. Rotational medicine ball throw velocity relates to NCAA Division III college baseball player bat swing, batted baseball, and pitching velocity. Journal of Strength and Conditioning Research. 2021;35(12):3414-3419. doi:10.1519/JSC.0000000000004148. https://pubmed.ncbi.nlm.nih.gov/34570055/ Why it matters here. Rotational power related to pitching velocity; jump tests did not. Use with care. Small descriptive study.
Lehman G, Drinkwater EJ, Behm DG. Correlation of throwing velocity to the results of lower-body field tests in male college baseball players. Journal of Strength and Conditioning Research. 2013;27(4):902-908. doi:10.1519/JSC.0b013e3182606c79. https://pubmed.ncbi.nlm.nih.gov/22706576/ Why it matters here. A lateral jump related to throwing velocity. Use with care. Not limited to pitchers; not repeated in the Division III study.
Force and leg-action research
Glover MA, Mylott JA, Gaba A, Recker AJ, Bullock GS, Waterman BR, Nicholson KF. The impact of drive leg impulse and slope on throwing velocity and kinematics in the competitive throwing athlete. Sports Health. 2025;17(4):862-869. Published online 2024. doi:10.1177/19417381241264502. https://pmc.ncbi.nlm.nih.gov/articles/PMC11569589/ Why it matters here. Greater drive-leg impulse went with lower velocity in the full cohort. Use with care. Retrospective; not retained in subgroup analyses.
Wasserberger KW, Giordano KA. Ground reaction forces in baseball pitching: temporal associations with pitch velocity among high-velocity pitchers. Sports Biomechanics. 2025;24(5):1464-1478. doi:10.1080/14763141.2023.2284828. https://pubmed.ncbi.nlm.nih.gov/37991012/ Why it matters here. The timing of lead-leg braking force related to velocity. Use with care. Observational. The first author is affiliated with Driveline Baseball, a commercial training company.
Matsuda R, Hirano Y, Umakoshi J, Kimura A. Energy flows with intentional changes in leg movements during baseball pitching. Frontiers in Sports and Active Living. 2025;7:1534596. doi:10.3389/fspor.2025.1534596. https://www.frontiersin.org/journals/sports-and-active-living/articles/10.3389/fspor.2025.1534596/full Why it matters here. Changing stride changed leg energy but not energy delivered to the trunk, and lowered velocity in both directions. Use with care. Flat-ground lab study; forced stride changes.
Yanagisawa O, Taniguchi H. Changes in lower extremity function and pitching performance with increasing numbers of pitches in baseball pitchers. Journal of Exercise Rehabilitation. 2018;14(3):430-435. doi:10.12965/jer.1836196.098. https://pmc.ncbi.nlm.nih.gov/articles/PMC6028199/ Why it matters here. Links hip fatigue to late-outing velocity loss. Use with care. Small, one simulated game.
Training research
Zhang H, Jiang Q, Li A. The impact of resistance-based training programs on throwing performance and throwing-related injuries in baseball players: A systematic review. Heliyon. 2023;9(12):e22797. doi:10.1016/j.heliyon.2023.e22797. https://www.sciencedirect.com/science/article/pii/S2405844023100053 Why it matters here. The central source for Section 4. Training beat comparison groups in eight studies, none of which tested a lower-body-focused strength or power program. Use with care. Moderate-quality included studies with no blinding.
Kim J, Jaber H, Yim J. Comparison of the effects of compound training, plyometric exercises, and kettlebell exercises on strength, power, dynamic balance, and pitched ball velocity in 30 male high school baseball pitchers aged 16-19 years. Medical Science Monitor. 2024;30:e944623. doi:10.12659/MSM.944623. https://medscimonit.com/abstract/full/idArt/944623 Why it matters here. The most lower-body-focused training study in pitchers. Use with care. No untrained comparison group; four weeks; authors noted radar limitations.
Equipment-task research (supports the tasks in Section 8, not the products)
Soligon SD, da Silva DG, Bergamasco JGA, et al. Suspension training vs. traditional resistance training: effects on muscle mass, strength and functional performance in older adults. European Journal of Applied Physiology. 2020;120:2223-2232. doi:10.1007/s00421-020-04446-x. https://link.springer.com/article/10.1007/s00421-020-04446-x Why it matters here. Suspension and traditional training gave similar leg-strength gains. Use with care. Untrained older adults; the authors’ limitations section was not available to us.
Ozdamar S, Agopyan A, Uzun S. The effects of dumbbell versus TRX suspension training on shoulder strength, vertical jump, and spike speed in volleyball players. Isokinetics and Exercise Science. 2024;32(2):109-123. doi:10.3233/IES-230001. https://journals.sagepub.com/doi/10.3233/IES-230001 Why it matters here. Jump height and power improved more with suspension training than dumbbells in young athletes. Use with care. 25 male volleyball players, eight weeks.
Lopes JSS, Machado AF, Micheletti JK, de Almeida AC, Cavina AP, Pastre CM. Effects of training with elastic resistance versus conventional resistance on muscular strength: a systematic review and meta-analysis. SAGE Open Medicine. 2019;7. doi:10.1177/2050312119831116. Corrigendum: SAGE Open Medicine. 2020;8:2050312120961220, doi:10.1177/2050312120961220. Why it matters here. Elastic and conventional resistance gave similar strength gains. Use with care. Eight studies, wide confidence intervals.
Stankovic D, Lazic A, Trajkovic N, Okicic M, Bubanj A, Vencurik T, Gasic T, Bubanj S. Effects of elastic band training on physical performance in team sports: a systematic review and meta-analysis. Journal of Functional Morphology and Kinesiology. 2025;10(4):402. doi:10.3390/jfmk10040402. https://pmc.ncbi.nlm.nih.gov/articles/PMC12551113 Why it matters here. Added band training improved jump, sprint, and change of direction in team-sport athletes. Use with care. No baseball studies; no head-to-head comparison with other resistance methods.
Timing and sequencing research
van der Graaff E, Hoozemans M, Nijhof M, Davidson M, Hoezen M, Veeger D. The role of pelvis and thorax rotation velocity in baseball pitching. ISBS Conference Proceedings Archive. 2016 (34th International Conference of Biomechanics in Sport). https://ojs.ub.uni-konstanz.de/cpa/article/view/6976 Why it matters here. The timing gap between pelvis and thorax rotation related to velocity; peak speeds alone did not. Use with care. Eight pitchers; conference abstract.
Covarrubias K, Pohl M, Jones B, Brady A. Torso and pelvis biomechanics associated with pitch velocity in baseball. International Journal of Exercise Science: Conference Proceedings. 2023;8(11):Article 13. https://digitalcommons.wku.edu/ijesab/vol8/iss11/13 Why it matters here. In a very large sample, pelvis rotation velocity alone showed no relationship with velocity. Use with care. Conference abstract; association only; two authors are affiliated with Driveline Baseball, a commercial training company.
Oliver GD, Keeley DW. Gluteal muscle group activation and its relationship with pelvis and torso kinematics in high-school baseball pitchers. Journal of Strength and Conditioning Research. 2010;24(11):3015-3022. doi:10.1519/JSC.0b013e3181c865ce Why it matters here. The glutes work near or above maximal effort during the stride and arm-cocking phases and relate to pelvis rotation rate. Use with care. Single-group EMG study; no training.
Palmer T, Uhl TL, Howell D, Hewett TE, Viele K, Mattacola CG. Sport-specific training targeting the proximal segments and throwing velocity in collegiate throwing athletes. Journal of Athletic Training. 2015;50(6):567-577. doi:10.4085/1062-6040-50.1.05 Why it matters here. The one randomized trial found supporting pelvis-and-trunk power work. Use with care. Division III baseball and softball players; the comparison was an endurance program; not lower-body strength training and not the Hip Spin.
Oyama S, Palmer T, Laudner K. Effects of an 8-week core training program on lumbopelvic-hip muscle function and pitching biomechanics in adolescent pitchers. Journal of Athletic Training. 2026;61(6):408-415. https://pubmed.ncbi.nlm.nih.gov/42245140/ Why it matters here. The closest controlled test of pelvis-and-hip strength training in pitchers: ball speed rose more than in controls. Use with care. A core-and-hip program, not leg strength alone; mechanics did not differ between groups and elbow varus moment rose.
Young WB. Transfer of strength and power training to sports performance. International Journal of Sports Physiology and Performance. 2006;1(2):74-83. doi:10.1123/ijspp.1.2.74. https://doi.org/10.1123/ijspp.1.2.74 Why it matters here. Supports the principle that transfer depends on specificity and coordination, with general strength retaining value. Use with care. Narrative review built on sprinting; not a pitching study.
Oates Education Hub
How to Increase Bat Speed: A Strength-First System for Power and Transfer. Oates Specialties Education Hub. https://oatesspecialties.com/blogs/education-hub/how-to-increase-bat-speed Why it matters here. The Oates strength argument for hitters, which this guide extends to pitching.
Strong in the Garage, Fast at the Plate: Building the Strength Foundation That Makes Everything Else Work. Oates Specialties Education Hub. https://oatesspecialties.com/blogs/education-hub/strong-in-the-garage-fast-at-the-plate Why it matters here. Examples of general lower-body strength work for coaches new to the weight room.
Practitioner sources
Wolforth R. Chasing the Wrong Rabbit. Texas Baseball Ranch. https://www.texasbaseballranch.com/blog/chasing-the-wrong-rabbit/ Classification. Practitioner interpretation, not peer-reviewed evidence.
Wolforth R. Wolforth Throwing Mentorship, Article 46: The Growing Threat to Youth Baseball. Perfect Game. https://www.perfectgame.org/articles/View.aspx?article=23336 Classification. Practitioner interpretation.
Sullivan R. Impulse and the Little Glutes: The Most Important Contributors to Pitching Velocity. Florida Baseball ARMory. https://floridabaseballarmory.com/impulse-and-the-gms-pitching-velocity/ Classification. Practitioner interpretation and private-practice force-plate model.
About This Analysis
Created by the Oates Specialties team led by Robert Oates, M.Ed., Founder
Editorial oversight by Gunnar Thompson, BS, CSCS, General Manager
Certified Strength & Conditioning Specialist | Biomechanics Specialist
October 2026
Complete Credentials
ROBERT OATES, M.Ed., Founder: Founded Oates Specialties in 2003. Master of Education degree. Provides strategic direction for educational content and athlete development philosophy.
GUNNAR THOMPSON, General Manager: BS Kinesiology (Clinical Exercise Science). CSCS (NSCA), PES (NASM), CPPS certifications. Technical authority on biomechanics and performance science. Conducts review of all educational content for scientific accuracy.
Questions or corrections: gunnart@oatesspecialties.com
© 2026, Oates Specialties LLC