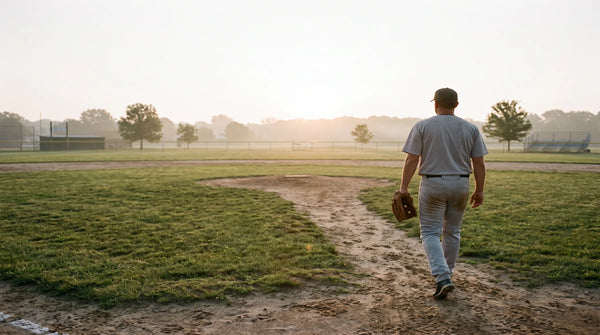
Why Does Deceleration Matter?
What the body does after ball release, how large the force is, which muscles meet it, and what a fall program can honestly build toward it.
From Fall to Opening Day · Coach’s Preparation Guide · OatesSpecialties.com
Part of: How to Build a Fall Pitching Program
Executive Summary: What Coaches Need to Know
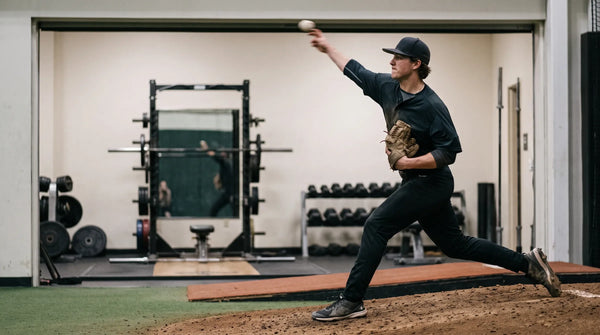
A pitcher does not finish the job at ball release. The arm is still moving fast, and in professional pitchers it is still speeding up.
The force after release is large. In skilled adult pitchers, the shoulder handled about 1090 newtons of compressive force, about 400 newtons of posterior force, and about 97 newton-meters of horizontal abduction torque shortly after release.
The muscles work near their limits. During arm deceleration, rotator cuff activity ran from 37 to 84 percent of maximum, the serratus anterior from 69 to 106 percent, and the trapezius from 51 to 78 percent.
It is not only the arm. The landing leg resists about three-quarters of body weight, and radar-gun velocity explains little of who carries the greatest arm load.
Some of this is trainable. A supervised 20-week program raised a posterior-shoulder endurance score in adolescent players from about 30 repetitions to 88, most of it in the first four weeks.
What is not established: that these muscles fatigue within an outing, that training changes the force or the injury risk, or that any score, tool, or program tells a coach a pitcher is ready. The one direct fatigue finding is at the elbow, and its timing in the pitch is not confirmed as deceleration.
Find Your Answer
Answer the question closest to what you need right now, and jump straight there.
- “How much force does the arm handle after release?” → Jump to: 3. What the Research Shows
- “Does training change that force or the injury risk?” → Jump to: 4. What the Research Does Not Settle
- “Can a coach measure any of this himself?” → Jump to: 5. Can a Coach Measure This Himself?
- “What can a fall plan honestly build?” → Jump to: 8. What a Fall Plan Should Build
- “What does a sample deceleration block look like?” → Jump to: 9. A Sample Deceleration Block
🎧 Prefer to listen? Audio version of this article:
1. The Coaching Situation: The Finish
A starter looks the same in the first inning every time out. Clean finish, quick arm. In the fifth and sixth he changes. The finish shortens, he flies off toward first base, and velocity eventually slips. Nothing hurts. He says he feels fine.
The usual reaction is to add running or rebuild the finish. The research does not say why this happens. What it does say is that the arm is asked to absorb a large force right after release, and that the muscles handling it are working hard. This guide looks at that demand and at what a fall block can honestly build toward it.
2. What Deceleration Means Here
What Actually Happens After You Pitch? owns the definition of deceleration and the whole-body response to an outing. This guide adds a narrower question: how much muscular capacity a pitcher has against one part of the load, what happens to it during an outing, and what a fall block can build.
A fall program can build selected supporting capacities: posterior-shoulder endurance, shoulder and scapular control, general and trunk strength, lower-body braking, and gradually increased throwing tolerance. It cannot establish readiness from one test, one exercise, or one bullpen.
3. What the Research Shows
The force after release is large. Shortly after release, skilled adult pitchers handled about 1090 newtons of shoulder compressive force, about 400 newtons of posterior force, and about 97 newton-meters of horizontal abduction torque. The authors named the rotator cuff’s role as a plausible route to tensile failure.
The muscular work is among the hardest in the pitch. Reviews of muscle recording put rotator cuff activity at 37 to 84 percent of maximum during arm deceleration, serratus anterior at 69 to 106 percent, and trapezius at 51 to 78 percent. Shoulder forces, torques, and muscle activity were generally greatest in arm cocking and arm deceleration.
The arm may still be accelerating at release. In professionals, peak shoulder internal rotation velocity came after release. High school pitchers peaked just before it. That means the stopping job starts later, and from a higher speed.
It is not only the arm. The landing leg resisted about 0.72 body weight in seven pitchers, and trunk timing and power predicted much of the variation in elbow valgus torque. Whole-body preparation is a reasonable choice. It is not shown to reduce arm stress in a given pitcher.
Velocity is a poor guide to who carries the load. In a thesis on 67 Division I pitchers, velocity and pulling force at the shoulder were only weakly related. A hard thrower is not automatically the pitcher under the greatest stress.
Posterior-shoulder endurance improves with training. In adolescent players, a supervised 20-week program raised an endurance score from about 30 repetitions to 88, with most of the gain in the first four weeks. It did not establish mound performance or injury prevention.
4. What the Research Does Not Settle
Whether these muscles fatigue in an outing has not been measured directly. No study identified for this guide measured the decelerating muscles before and after pitching. In 13 pitchers, post-game strength fell in shoulder internal rotation, flexion, and adduction, but those are not the stopping muscles. The demand figures make fatigue plausible. They do not prove it.
The direct fatigue finding is at the elbow, and its timing is uncertain. In collegiate pitchers, the muscular strength that resists the opening force at the inner elbow fell about 10 percent over seven innings while the load did not change, and 10 of 22 pitchers lacked the strength to fully offset a fastball’s peak demand even when fresh. That peak is usually taken near late cocking, before release, so this guide does not treat it as a deceleration result. It does show that the muscles around the arm have little spare margin.
Preseason strength does not reliably predict who gets hurt. One professional study found several shoulder-strength measures associated with later injury. A high-school study found most of them unrelated. A strength screen is information, not a forecast.
5. Can a Coach Measure This Himself?
Partly, and with care.
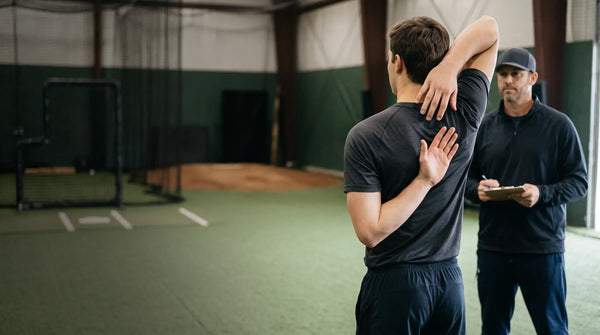
A fixed posterior-shoulder task is a repeatable observation. The Posterior Shoulder Endurance Test comes in at least three versions that do not produce comparable numbers, some scored in repetitions and some in seconds. Use one version: same position, same load, same cadence, same point in the week, same person counting. Even then, small changes can fall inside measurement error.
A coach cannot read a number off a chart. No baseball norms exist, no cutoff clears anyone, and no study links a score to injury or workload. The force and muscle-activity figures above come from motion capture and electromyography. What a coach can see is the consequence: whether task quality, finish, and reported feel hold up across a session.
Compare the athlete with himself. Values differ by population and protocol, and the baseline moves. In one small softball study, scapular force fell across a fall while reported function did not change. A September number is not a November number.
6. Practitioner Lens: Capacity or Arm Path?
Practitioner lens: applied interpretation, not peer-reviewed proof. These positions come from experienced practitioners with published material. They help organize a decision research has not settled. Neither has been tested against an alternative in a trial.
Commercial transparency. Ron Wolforth, Randy Sullivan, and Oates Specialties operate commercial baseball training businesses. Wolforth and Sullivan use Oates products in their facilities and have commercial relationships with Oates. Their frameworks appear as examples of applied reasoning, not independent validation.
Wolforth: deceleration is a capacity, and it gates velocity. His step three for adding velocity in-season is to become a more effective, efficient decelerator. He quotes the line that the body will only accelerate as efficiently as it can decelerate, and proposes that the body restricts acceleration when it doubts it can stop the arm. He calls this a belief. The mechanism has no published experimental support in pitching.
Sullivan: it is an arm path problem. His account is that the biceps ends up working eccentrically against distraction at release, and that internal rotation and pronation through the finish quiet it. He rejects bands, rows, and reverse throws because they are concentric.
What a coach can borrow from both. Watch the finish before adding volume. If the arm rotates and pronates through it, capacity work can begin at low demand and be judged by response. If it extends linearly toward the catcher, treat the finish as an observation worth addressing before assuming more repetitions are the answer. Neither practitioner has published evidence that his ordering changes an outcome.
7. The Sock: What Both Practitioners Actually Say
No study has tested a throwing sock against anything. What exists is practitioner use, and it is more varied than a single description suggests.
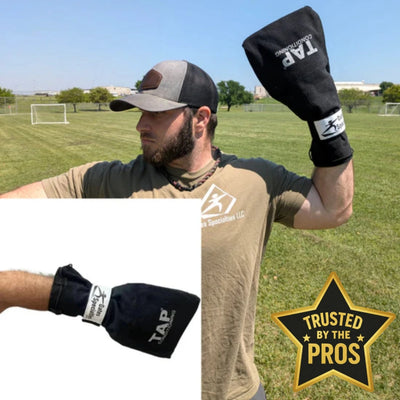
Wolforth: a low-intensity deceleration tool, used in routines. He names the Durathro™ Sock, the bell club, and the Weighted Forearm Sleeve as tools for deceleration work, and says the work “can be done at lower intensities” within arm care, ramp-up, and post-throwing. In his in-season material, the sock sits in a daily post-throwing routine of about ten minutes, alongside kettlebell carries, light stretching, and foam rolling, described as aiding recovery. He also lists the sock and the weighted forearm sleeve as “connection tools” for refining mechanics, and says to use them “a little, a lot”: frequent, consistent short exposures rather than long, occasional sessions. He gives no sets, reps, or counts.
Sullivan: a contained throw that cues the finish. In his 2019 article, the sock is a canvas sleeve that tethers two fingers while the rest of the hand holds a slightly overloaded ball, 7 ounces. The athlete throws with normal, full-intent motion into the end of the sock, about four inches past the fingertips. He argues that impact encourages internal rotation, that the posterior muscles stay active through the whole deceleration phase, and that the short distance is the point: a longer one would encourage a linear pattern. In later off-season material, he describes sub-maximal sock drills “all winter long” with corrective work, so that tissue stays organized while an athlete lifts and the return to throwing is faster and lower risk.
What this adds up to. Documented uses include post-throwing, ramp-up, arm care, mechanics drills, and winter maintenance. How Should Lifting and Throwing Fit Together? covers the eccentric-training evidence for finishing weight-room sessions with it. Coaches at high schools, colleges, and training facilities tell us they already use the sock this way and are happy with the results. The research has not tested the sock itself yet. In-Season Arm Care for Pitchers carries the in-season implementation pattern. Neither practitioner names the TAP® Baseball Training Sock, and the sources carry a commercial link, so this is practitioner use, not product proof.
8. What a Fall Plan Should Build
The fall is the right window because these capacities are ones a block can address. Five are worth naming:
- Posterior-shoulder endurance: controlled shoulder work with organized form.
- Shoulder and scapular control: organized positions in low-to-moderate demand tasks.
- Lower-body braking and trunk contribution: so the arm is not the only brake.
- Throwing tolerance: reconnect training capacity to progressive throwing.
- Forearm capacity: controlled low-load work, with load added only after the task holds.
None proves protection or readiness. Build the task before the demand: teach it at low demand, repeat it with quality, add one demand at a time, and find out how he handled it before adding another. The 20-week study supports the light-and-frequent template: lower resistance, higher repetitions, expect change inside a month, and keep going, because 20 weeks produced more than four.
9. A Sample Deceleration Block
This is an illustration of how one block could run, built from the guide’s own logic and the practitioner uses above. It is Oates Specialties’ suggestion. It is not a protocol the research tested, and no study supports specific sets, reps, loads, or timing.
Weeks 1 to 4: observe and build a light base. Pick one fixed posterior-shoulder task and record how long quality holds. Add short, frequent sessions of it. Where the athlete throws regularly, a coach might add a roughly ten-minute post-throwing routine that includes low-intensity throws into a sock, along the lines Wolforth describes. Watch the finish early and late in a session.
Weeks 5 to 8: change one thing. If quality holds, extend duration or add one main demand: a little more resistance, or a few more low-intent sock throws. If quality drops only late, hold the demand and extend the time at it rather than adding load. If it drops right after a new demand, simplify that demand. Keep it away from the week throwing volume rises or a showcase lands.
Beyond week 8: keep going. The 20-week study kept improving past the first month, so a coach might continue the light work, recheck the same task at the same point in the week, and compare the athlete with his own earlier result.
Judge it by the finish. The question at the end of a block is not whether a score moved. It is whether he finishes a throwing task late in a session the way he finished it early. A capacity gain with no immediate change in the finish is normal. It is not proof the work failed.
Watch for quality holding or fading, compensation late in a session, and recovery that looks different for one athlete. Pain, unusual symptoms, or an existing restriction move the situation outside this guide (Section 12).
10. Tools as Examples
Commercial transparency. Oates Specialties designs and sells baseball training equipment, including the products below. This guide does not claim that any Oates product improves health, readiness, velocity, or injury outcomes.
Equipment belongs after the coaching objective is settled. The tools below differ in where the load sits. The sock, covered in Section 7, contains a throw. The sleeve loads the arm during the throw. Resisted forearm work loads the same muscles away from it.
The table below separates what each category can help create from what it cannot establish.
| Coaching objective | What the category may help create | What it cannot establish | Oates example |
|---|---|---|---|
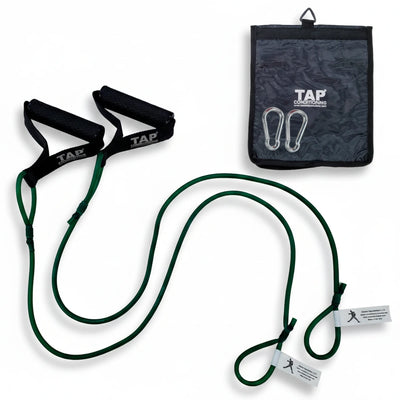
| Repeatable low-load shoulder and scapular work | Controlled resistance an athlete can repeat with form, for longer over time | That the work protects a joint or establishes readiness | TAP® resistance tubing |
| A contained, low-intent throwing task where the finish is easy to see | A repeatable throwing pattern with visible feedback about a continuous finish | Tissue status, clearance, or a substitute for a throwing progression | TAP® Baseball Training Sock |
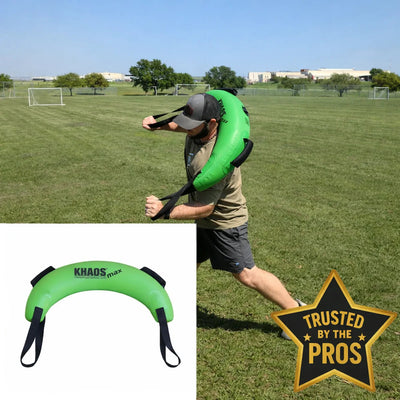
| Whole-body rotational control under changing load | A variable coordination and braking challenge | Reproduction of pitching, or transfer to the mound | KHAOS® Bulgarian Water Bag, KHAOS® Water Ball |
| A visible practice result to discuss | A clearer conversation about the task outcome | A mechanical diagnosis or a workload verdict | SpinAid®, TAP® target systems |
| Load the throwing pattern itself, rather than the same muscles in a different pattern | Added rotational demand through the arm’s own movement, with the ball, grip, and release unchanged | A velocity or health outcome, or that a 16-ounce load behaves like the lighter loads that have been studied | TAP® Weighted Forearm Sleeve |
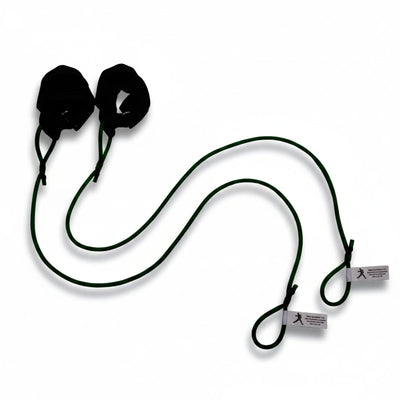
| Build forearm capacity away from the throw | A repeatable, progressable load on muscles documented as restraints against the elbow being forced open | That a stronger forearm protects the ligament, reduces injury, or changes the delivery | TAP® First Responder (elastic), TAP® Supi-Pro™ (leveraged weight) |
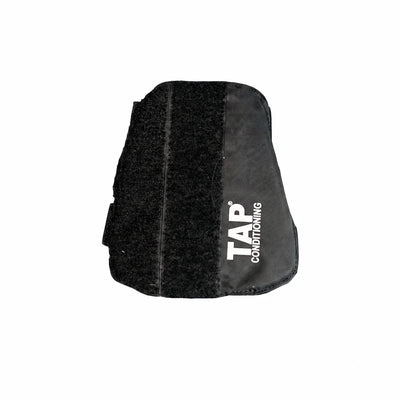
TAP® Weighted Forearm Sleeve. It adds rotational demand through the arm’s own movement, with ball, grip, and release unchanged. Research on light attached loads supports the mechanism: joint angular velocity rose while joint angles barely moved. In one baseball study of ten pitchers, loads of 100 to 200 grams did not change pitch timing, and other throwing programs were null. A sixteen-ounce sleeve is about 454 grams, above every load in that baseball study. A coach who uses it should treat it as an unvalidated low-speed arm-control task, progress it conservatively, and judge it by the athlete’s response.
Resisted forearm work (TAP® First Responder, TAP® Supi-Pro™). The name comes from Sullivan, who calls the muscles near the inner elbow “first responders.” In ten healthy adults using bands, resisted pronation produced the highest activation tested. The tubing and the leveraged weight are different loads, and no elbow measurement exists for either. They create a repeatable, progressable load on muscles documented as restraining the elbow. No study supports the step from a stronger forearm to a protected ligament, and the one trial that looked did not find it. Higher settings are untested, not more training.
The rule. Choose the objective first, the task second, and a product last. Research supporting an objective does not validate a product, including ours. A product link should ship only when its page keeps this guide’s evidence boundary.
11. Athlete Action and Parent Note
Athletes: The throw does not end at release. How you finish late matters more than how you feel in the first inning. Report sharp, unusual, persistent, or worsening symptoms early. Do not add deceleration drills, weighted work, or high-intent throwing because a teammate is. Tell the staff about outside bullpens, lessons, and showcases.
Parents: You do not need to coach a finish. “He said he felt good” is not the whole picture, and a test number is not a verdict. What helps most is information: outside throwing, schedule changes, existing restrictions, and changes in symptoms.
12. Safety Boundary: When Coaching Gives Way to Evaluation
This guide is written for coaches of male baseball pitchers from junior high through college. Some research uses professional or collegiate pitchers and does not automatically carry across ages. It is preparation guidance, not diagnosis, injury prediction, rehabilitation, or clearance to play.
Persistent, sharp, unusual, worsening, or function-limiting pain is outside this guide’s scope. Existing restrictions or return-to-throw instructions lead the plan. A tired-looking finish or a low score on a shoulder task does not diagnose an athlete. Coaches ask, record, notice, monitor, adjust, coordinate, and refer. Qualified professionals evaluate, diagnose, and determine medical clearance.
13. Where This Guide Fits in the Series
The Audit: What Pitcher Is Actually in Front of Me? sets exposure and runway. What Actually Happens After You Pitch? owns the definition of deceleration. How Should Lifting and Throwing Fit Together? owns what the weight room builds, What a Mobility Screen Actually Tells You owns movement information, In-Season Arm Care for Pitchers owns daily routines, and How Do Pitchers Safely Add Velocity? owns weighted implements.
14. The Next Coaching Question
Deceleration is one way a pitcher manages force after release. The next question moves down the body: What do the hips have to do with the elbow? That guide looks at how hip and trunk contributions relate to the throwing task, and why a coach should not turn one lower-body finding into a mechanical diagnosis.
Evidence and Sources
The coaching guide ends above. What follows is the evidence apparatus. The sock section was extended in this version with one added practitioner source, which was read directly.
How to read this evidence
Verification note. Every entry below carries a review level, and the four levels mean different things. Appendix A defines them. Of the forty research sources, twenty-one were reviewed at full text, including all three graduate works. Sixteen were reviewed at the published abstract, which means the abstract and the bibliographic record but no independent reading of methods or results. Two were reviewed at the bibliographic record, one of them with a publisher summary. One was not retrieved at all, so no finding is drawn from it. All three practitioner sources and the Education Hub source were read at full text, directly.
Independently of review level, every citation’s author list, year, volume, issue, and page range was verified against the Crossref record for its DOI or against the publisher’s record. Sources owned by other guides in this series are cross-referenced rather than restated.
A note on one retrieval problem. The Perfect Game website serves session-keyed pages and returned inconsistent content to automated retrieval during this review. The Wolforth article cited below was confirmed by two independent retrievals that agreed verbatim. An earlier draft of this guide cited a different article number at a URL whose content is about pitch counts; that citation was wrong and has been corrected.
Annotated bibliography
Each entry states what the source found, how far it can be pushed, and the level at which it was reviewed.
Primary research
Yanai T, Onuma K, Nagami T. Varus Strength of the Medial Elbow Musculature for Stress Shielding of the Ulnar Collateral Ligament in Competitive Baseball Pitchers. Medicine & Science in Sports & Exercise. 2025;57(4):791-799. doi:10.1249/MSS.0000000000003614
Why it matters here. The central evidence that a pitcher’s muscular contribution to resisting elbow valgus load is about the same size as the demand a fastball creates. In 22 competitive pitchers, 14 professional and 8 collegiate, maximum voluntary isometric varus strength averaged 57.5 plus or minus 9.2 newton-meters, measured with ultrasound of the medial joint space so the value reflected muscle rather than ligament. Peak varus moment while pitching averaged 103.1 plus or minus 26.5 percent of that strength for a fastball, 99.4 for a slider, 92.9 for a changeup, and 89.1 for a curveball, with only the curveball significantly below. Ten of the 22 lacked the strength to fully unload the ligament, and the largest excess was 33.0 newton-meters.
Use with care. The abstract reviewed does not state the pitch phase of the peak varus moment. Cross-sectional, with no training arm and no injury follow-up. Isometric testing may not represent eccentric output during pitching, and the authors note they did not characterize velocity dependence, fatigue, or pre-stretch. A Japanese professional and collegiate sample, nine with prior shoulder or elbow pain and four with prior ligament reconstruction.
Verification. Published abstract reviewed. Citation and three-author list verified against the Crossref record for the DOI.
Yanai T, Onuma K. Weakening of the Active Muscle Restraint Against Valgus Loading During Repeated Baseball Pitching: Direct Evidence of Fatigue in Dynamic Valgus Stabilizers of the Elbow Joint in Collegiate Baseball Pitchers. The American Journal of Sports Medicine. 2026;54(10):2481-2490. doi:10.1177/03635465261460711
Why it matters here. The one direct fatigue finding in this guide, at the elbow rather than in the stopping muscles. Twenty-eight collegiate pitchers threw seven innings of fifteen pitches, with varus strength and elbow valgus load measured before the first inning and after the fourth and seventh. Varus strength decreased significantly, by roughly 10 percent, while valgus load remained constant. Varus strength was significantly greater than the mean valgus load in the first inning and was not in the later innings, which the authors read as increased reliance on the ligament as an outing continues.
Use with care. The instant of the pitch from which the load is taken is not stated in the abstract reviewed, and peak elbow load is usually placed near late cocking, so this guide does not treat it as a deceleration result. A controlled seven-inning protocol rather than a game, in collegiate pitchers rather than adolescents. It measured strength and load, not injuries, and did not test whether training alters the decline.
Verification. Published abstract reviewed. Citation, year, volume, issue, and page range verified against the Crossref record for the DOI.
Moore SD, Uhl TL, Kibler WB. Improvements in Shoulder Endurance Following a Baseball-Specific Strengthening Program in High School Baseball Players. Sports Health. 2013;5(3):233-238. doi:10.1177/1941738113477604
Why it matters here. The trainability claim the fall rests on, and the only posterior-shoulder endurance evidence in baseball players. Fourteen adolescent players, average age 16 plus or minus 2, completed 20 weeks of three supervised sessions per week, beginning with lower-resistance higher-repetition shoulder, scapular, and forearm work and later adding weight-room training. The endurance score rose from 30 plus or minus 14 repetitions to 66 plus or minus 26 at four weeks and 88 plus or minus 36 at 20 weeks, while rotation range of motion and the external-to-internal rotation strength ratio did not significantly change.
Use with care. Fourteen compliant athletes, no control group, mixed positions. A single-arm cohort cannot separate training from maturation, season effects, or learning the test, and the outcome was a score rather than throwing tolerance or injury. This guide owns this source within the series; How Should Lifting and Throwing Fit Together? should cross-reference it rather than report its findings.
Verification. Published abstract reviewed. Citation and author list verified against the Crossref record for the DOI. Methods paywalled, so the reported values come from the published abstract. The exact protocol described in Section 5 comes from a secondary rendering of the article’s figure and should be confirmed against the published methods before a coach reproduces it.
Evans NA, Konz S, Nitz A, Uhl TL. Reproducibility and discriminant validity of the Posterior Shoulder Endurance Test in healthy and painful populations. Physical Therapy in Sport. 2021;47:66-71. doi:10.1016/j.ptsp.2020.10.014
Why it matters here. The measurement-error boundary for Section 5. Thirty subjects, 25 retested. Scored as time to failure, the isometric test produced an intraclass correlation of 0.85 without shoulder pain, a standard error of measurement of 7.3 seconds, and a minimal detectable change at the 90 percent level of 17 seconds. With shoulder pain the values were 0.77, 13.1 seconds, and 30.6 seconds.
Use with care. Thirty mixed-sex adults from clinics and word of mouth, not athletes and not baseball players. Discriminating people who already have pain is not predicting injury. Published cutoff values differ between the paper and the related dissertation in which sex they attach to, so this guide reports no cutoff.
Verification. Published abstract reviewed. Author list independently confirmed twice, against the publisher record and Crossref. For internal use: at least one circulating document misattributes this paper to a different research group.
Evans NA, Dressler E, Uhl T. An electromyography study of muscular endurance during the posterior shoulder endurance test. Journal of Electromyography and Kinesiology. 2018;41:132-138. doi:10.1016/j.jelekin.2018.05.012
Why it matters here. The clearest published account of how the isometric test is administered, and the source for this guide’s statement that the 90-degree position is the more useful one. Fifty-five participants were tested prone at 90 and 135 degrees of abduction with load standardized by external torque, 21 plus or minus 1 newton-meters for males and 13 plus or minus 1 for females, scored as time to task failure. Mean time to failure at 90 degrees was 68.5 plus or minus 2.8 seconds for males and 58.1 plus or minus 2.4 for females. The posterior deltoid fatigued faster than the trapezius.
Use with care. Healthy non-athlete adults. Torque-standardized loading is not the percent-of-body-weight loading used in the baseball study, so scores are not comparable.
Verification. Full text reviewed, through an open institutional copy.
Fleisig GS, Andrews JR, Dillman CJ, Escamilla RF. Kinetics of Baseball Pitching with Implications About Injury Mechanisms. The American Journal of Sports Medicine. 1995;23(2):233-239. doi:10.1177/036354659502300218
Why it matters here. The measured load shortly after ball release in 26 highly skilled adult pitchers: about 1090 newtons of shoulder compressive force, about 400 newtons of posterior force, and about 97 newton-meters of horizontal abduction torque. The authors name the rotator cuff’s contribution as a plausible route to cuff tensile failure.
Use with care. A group study in skilled adults that sets no safe threshold and diagnoses no one. It reports forces in newtons without normalizing to body weight, so it cannot be cited for a body-weight multiple.
Verification. Published abstract reviewed. Citation and four-author list verified against the Crossref record for the DOI.
Escamilla RF, Andrews JR. Shoulder Muscle Recruitment Patterns and Related Biomechanics during Upper Extremity Sports. Sports Medicine. 2009;39(7):569-590. doi:10.2165/00007256-200939070-00004
Why it matters here. Establishes that the muscular work of deceleration is among the hardest in the pitch. Reports rotator cuff activity of 37 to 84 percent of maximum voluntary isometric contraction during arm deceleration in baseball pitching, serratus anterior activity of 69 to 106 percent, and trapezius activity of 51 to 78 percent, and concludes that shoulder forces, torques, and muscle activity are generally greatest during arm cocking and arm deceleration.
Use with care. A narrative review synthesizing other laboratories’ electromyography, not a trial. It reports the rotator cuff as a band rather than muscle by muscle, and this guide does not break that band apart.
Verification. Published abstract reviewed, plus partial body text. Citation and two-author list verified against the Crossref record for the DOI.
MacWilliams BA, Choi T, Perezous MK, Chao EYS, McFarland EG. Characteristic Ground-Reaction Forces in Baseball Pitching. The American Journal of Sports Medicine. 1998;26(1):66-71. doi:10.1177/03635465980260014101
Why it matters here. The lead-leg braking figure. Force plates under both feet with simultaneous kinematics in seven pitchers found the push-off leg generating 0.35 body weight of shear force toward the plate and the landing leg resisting 0.72 body weight, with wrist velocity correlating highly with increased leg drive.
Use with care. Six collegiate and one high-school pitcher. A seven-athlete sample supports a general statement about where braking happens and nothing about an individual.
Verification. Published abstract reviewed. Citation and five-author list verified against the Crossref record for the DOI.
Aguinaldo A, Escamilla R. Segmental Power Analysis of Sequential Body Motion and Elbow Valgus Loading During Baseball Pitching: Comparison Between Professional and High School Baseball Players. Orthopaedic Journal of Sports Medicine. 2019;7(2):2325967119827924. doi:10.1177/2325967119827924
Why it matters here. Two things. Maximum shoulder internal rotation velocity occurred at 102.4 plus or minus 8.9 percent of the pitch cycle in professionals and 93.0 plus or minus 11.7 percent in high schoolers, meaning the professional arm was still accelerating at release. And trunk rotation time, trunk power, and upper arm power together predicted maximum elbow valgus torque with an r of 0.823, about 68 percent of its variation.
Use with care. Sixteen professionals and 15 high schoolers, cross-sectional. Differences between levels are not a development plan, and nothing here shows that changing a trunk measure lowers elbow load in a given pitcher.
Verification. Full text reviewed, open access. Citation and two-author list verified against the Crossref record for the DOI.
Byram IR, Bushnell BD, Dugger K, Charron K, Harrell FE Jr, Noonan TJ. Preseason Shoulder Strength Measurements in Professional Baseball Pitchers: Identifying Players at Risk for Injury. The American Journal of Sports Medicine. 2010;38(7):1375-1382. doi:10.1177/0363546509360404
Why it matters here. One half of the unsettled question about whether preseason strength predicts injury. All pitchers in one professional organization across five seasons. Prone external rotation strength at P equals .003, seated external rotation at P equals .048, and supraspinatus strength at P equals .006 were each associated with throwing injury requiring surgery, and supraspinatus strength with any shoulder injury at P equals .031. No associations appeared in the subgroup with prior surgery.
Use with care. Professional pitchers, the population furthest from this guide’s audience. Rank correlation with no odds ratios or confidence intervals, so effect size is unavailable. Read alongside the high-school study below, which did not reproduce most of these associations.
Verification. Published abstract reviewed. Citation and six-author list verified against the Crossref record for the DOI.
Tyler TF, Mullaney MJ, Mirabella MR, Nicholas SJ, McHugh MP. Risk Factors for Shoulder and Elbow Injuries in High School Baseball Pitchers: The Role of Preseason Strength and Range of Motion. The American Journal of Sports Medicine. 2014;42(8):1993-1999. doi:10.1177/0363546514535070
Why it matters here. The other half, in the right population. One hundred one pitchers at four high schools across four seasons, 166 pitcher-seasons, 28 upper-extremity injuries, an incidence of 0.58 per 1000 pitches. Supraspinatus weakness showed a trend at a relative risk of 3.60 with a confidence interval of 0.75 to 17.32, reaching significance for injuries costing more than three games at 4.58 with an interval of 1.40 to 15.01. Scapular retraction, internal rotation, and external rotation measures were unrelated to risk. Pitchers with no internal rotation loss were at higher risk than those with 20 degrees or more of loss, at 4.85 with an interval of 1.01 to 23.29.
Use with care. The paper states a prospective purpose but is labeled a case-control study at level of evidence 3, and this guide reports it as labeled. The confidence intervals are wide enough that effect sizes should not be treated as precise. The internal rotation result runs against common coaching assumptions and appears here because it is in the paper, not because it is settled.
Verification. Published abstract reviewed. Citation and five-author list verified against the Crossref record for the DOI.
Aso T, Kagaya Y. Relationship between the shoulder, trunk, and pelvis kinematics during the deceleration phase of throwing. JSES International. 2024;8(4):740-745. doi:10.1016/j.jseint.2024.03.008
Why it matters here. One of very few studies to measure the deceleration phase specifically. Seventeen adult male recreational players throwing on flat ground, captured at 1000 hertz and analyzed at maximum shoulder internal rotation, where internal rotation angle was negatively associated with spinal flexion at P equals .006 and spinal rotation at P equals .010, with no other significant associations detected.
Use with care. Recreational-level throwers on flat ground, not pitchers off a mound, and an association at a single instant rather than a cause.
Verification. Published abstract reviewed, open access. Citation and two-author list verified against the Crossref record for the DOI.
Tsutsui T, Sakamaki W, Maemichi T, Torii S. Relationship of Forearm-Hand Inertia With Throwing Motion Patterns and Elbow Valgus Load in Adolescent Baseball Players. Orthopaedic Journal of Sports Medicine. 2024;12(10):23259671241272488. doi:10.1177/23259671241272488
Why it matters here. The nearest study to the question of mass out at the forearm, and it runs counter to the intuition behind distal-loading tools. Thirty-five adolescent players aged 13 to 15 were scanned by dual-energy x-ray absorptiometry and motion captured while throwing, with elbow valgus load recorded by a sensor on the medial ulna. Players using a proximal upper-extremity pattern showed significantly higher valgus load and poorer throwing efficiency, and those differences disappeared when forearm-hand inertia was statistically controlled. Inertia mediated the relationship.
Use with care. The study tested no weighted sleeve, strap, or added load of any kind. Inertia from a growing limb is not the same variable as an added implement. Its wearable sensor was a measurement device of negligible mass, not a load. This guide cites it as a reason for caution about adding forearm mass during throwing in this age group, not as evidence about any product.
Verification. Full text reviewed. Citation and four-author list verified against the publisher record.
Diffendaffer AZ, Bagwell MS, Fleisig GS, et al. The Clinician’s Guide to Baseball Pitching Biomechanics. Sports Health. 2023;15(2):274-281. doi:10.1177/19417381221078537
Why it matters here. Background context describing deceleration as a distinct phase of the pitch, used here only as general framing.
Use with care. A level 5 clinical review. It reports foot-contact-to-release parameters and supplies no deceleration-phase kinetic values, so no number in this guide is attributed to it.
Verification. Bibliographic record reviewed, plus a publisher summary. Title, journal, year, volume, issue, and page range verified against the publisher record. The author list beyond the first three names is not independently confirmed and is abbreviated here rather than reproduced.
Garner S, Wicke J, Legreaux S, Chianchiano B. Effects of deceleration-focused exercise strategies on shoulder range of motion and throwing velocity in baseball and softball athletes. Sports Biomechanics. 2021;20(1):86-95. doi:10.1080/14763141.2018.1556325
Why it matters here. Named because it is the only published trial identified that tested deceleration-focused exercise directly in throwing athletes, and a reader deserves to know it exists.
Use with care. The full text and abstract could not be obtained during this review; the publisher returned an access error on repeated attempts and the usual index routes were unavailable. This guide draws no finding from it. Its stated outcomes are shoulder range of motion and throwing velocity, not injury or workload tolerance, so even when read it would not answer the question in Section 4.
Verification. Not retrieved. Citation, four-author list, year, volume, and page range verified against the Crossref record for the DOI. Findings not reviewed and none used.
Buffi JH, Werner K, Kepple T, Murray WM. Computing Muscle, Ligament, and Osseous Contributions to the Elbow Varus Moment During Baseball Pitching. Annals of Biomedical Engineering. 2015;43(2):404-415. doi:10.1007/s10439-014-1144-z
Why it matters here. The strongest available version of the argument that muscular capacity could reduce ligament load, and an honest illustration of its limits. A forward-dynamic musculoskeletal simulation found that increasing modeled muscle strength or activation decreased computed ligament load.
Use with care. A simulation of one high-school pitcher. The result is a parameter manipulation inside a model. No athlete was trained and no load was measured before and after a program.
Verification. Published abstract reviewed. Citation and four-author list verified against the Crossref record for the DOI.
Park MC, Ahmad CS. Dynamic Contributions of the Flexor-Pronator Mass to Elbow Valgus Stability. The Journal of Bone and Joint Surgery. 2004;86(10):2268-2274. doi:10.2106/00004623-200410000-00020
Why it matters here. The anatomical basis for the idea that muscle can shield the ligament. In six cadaveric elbows with a simulated complete ligament tear, the flexor carpi ulnaris was the primary dynamic stabilizer against valgus, the flexor digitorum superficialis secondary, and the pronator teres contributed least.
Use with care. Six cadaveric specimens under simulated loading. It establishes which muscles can contribute, not that training them changes anything in a living thrower.
Verification. Bibliographic record reviewed. Citation and two-author list verified against the Crossref record for the DOI, and the finding drawn here is the one stated in the published record.
Job TDW, Cronin JB, Crotin R, Cross MR. Acute Effects of Wearable Resistance Applied to the Throwing Arm on Performance in Baseball Pitchers. Journal of Strength and Conditioning Research. 2025;39(3):340-346. doi:10.1519/JSC.0000000000004991
Why it matters here. The only study to test attached limb loading directly in baseball pitchers. Ten healthy high-school and collegiate pitchers, mean age 19.5, threw with 100, 150, and 200 gram loads placed above the elbow on the lateral upper arm or below it on the mid dorsal forearm. Pitch-phase timing, 151 to 154 milliseconds unloaded, did not differ at any load or placement. Below-elbow loads reduced ball velocity by 1.8 to 2.7 percent and arm speed by 5.1 to 6.5 percent; above-elbow loads produced no significant change in either.
Use with care. Ten pitchers, acute single-session design, no training arm and no injury follow-up. The 200 gram ceiling was set by pilot testing for what would stay attached and not bother the athlete, not by any biomechanical threshold, so this study does not establish where a threshold lies. It measured velocity, arm speed, and timing, not elbow or shoulder kinetics.
Verification. Full text reviewed, as the author-accepted manuscript through an institutional repository. Citation, four-author list, year, volume, issue, and page range verified against the Crossref record for the DOI.
Feser EH, Neville J, Wells D, et al. Lower-limb wearable resistance overloads joint angular velocity during early acceleration sprint running. Journal of Sports Sciences. 2023;41(4):326-332. doi:10.1080/02640414.2023.2209759
Why it matters here. The clearest direct test of the pattern-preservation claim. Eighteen male university sprinters ran with loads of about 2 percent of body mass on the distal thigh or shank. Significant peak joint-angle changes were small and under 2 degrees on average, while hip and knee angular velocity fell meaningfully, and 10 metre sprint time rose less than 1.5 percent. The authors concluded the loading schemes do not produce appreciably different movement patterns.
Use with care. Sprinting, not throwing, and a leg rather than an arm. The authors note individual responses reached plus or minus 8 degrees even where the group mean moved under 2, and recommend assessing each athlete individually. Acute, with no training outcome.
Verification. Full text reviewed through an institutional repository. Citation and twelve-author list verified against the Crossref record for the DOI; abbreviated here.
Macadam P, Cronin JB, Simperingham KD. The Effects of Wearable Resistance Training on Metabolic, Kinematic and Kinetic Variables During Walking, Running, Sprint Running and Jumping: A Systematic Review. Sports Medicine. 2017;47(5):887-906. doi:10.1007/s40279-016-0622-x
Why it matters here. The field’s own statement of the rationale this guide reports: wearable resistance training provides a means of activity-specific or movement-specific overloading, supposedly resulting in better transference to dynamic sporting performance. Thirty-two studies.
Use with care. The authors’ own summary is that research in this area is still clearly in its infancy, and that acute limb loading significantly reduced velocity during sprint running at every load tested. No throwing studies were included.
Verification. Published abstract reviewed, plus partial body text. Citation and three-author list verified against the Crossref record for the DOI.
Fredriksen AB, van den Tillaar R. The Acute Effects of Different Wearable Resistance Loads Attached to the Forearm on Throwing Kinematics, Myoelectric Activity and Performance in Experienced Female Handball Players. Journal of Functional Morphology and Kinesiology. 2022;7(3):58. doi:10.3390/jfmk7030058
Why it matters here. The best evidence that a forearm load leaves the throwing pattern intact. Thirteen experienced players threw with body-mass-banded loads of 150 to 500 grams on a forearm sleeve. Muscle activity showed no significant condition effects, maximal joint angles and timing did not change, and accuracy was unaffected. Ball velocity fell about 2.7 percent, which the authors attribute to reduced maximal internal shoulder rotation velocity.
Use with care. Thirteen female handball players, acute design. Handball throwing is not pitching, and elbow extension velocity rose while shoulder internal rotation velocity fell, so coordination redistributed even as the gross pattern held.
Verification. Full text reviewed, open access. Citation and two-author list verified against the Crossref record for the DOI.
Fredriksen AB, van den Tillaar R. Effect of Six Weeks of Training with Wearable Resistance Attached to the Forearm on Throwing Kinematics, Strength, and Velocity in Female Handball Players. Journal of Functional Morphology and Kinesiology. 2025;10(1):45. doi:10.3390/jfmk10010045
Why it matters here. The one positive training outcome for forearm loading in an overhead sport. Twenty-five experienced players, six weeks, twelve sessions, loads progressing from 100 to 300 grams per arm inside normal training. Throwing velocity in the trained group rose about 4 percent with a significant between-group interaction; controls did not change. Strength on a pulley device did not change.
Use with care. Handball, not baseball, and female players. The authors attribute the velocity gain to changed ball-release kinematics, more elbow flexion, wrist flexion, and shoulder flexion, rather than to a preserved pattern. That matters: the benefit here is credited to pattern change, not pattern preservation.
Verification. Full text reviewed, open access. Citation verified against the publisher record.
Mielniczek M, Lunde P, Grzyb W, van den Tillaar R. Effect of Eight Weeks of in Season Training with Wearable Resistance Attached to the Forearm on Spike Velocity in Female Volleyball Players. Journal of Functional Morphology and Kinesiology. 2025;10(4):458. doi:10.3390/jfmk10040458
Why it matters here. Included because it is negative and the guide reports negative results. Thirteen senior players, eight weeks in season, forearm loads progressing from 50 to 200 grams. Spike velocity fell about 2.1 percent in both the forearm group and the calf-loaded comparison group, with no interaction.
Use with care. Thirteen players, volleyball spiking rather than throwing, and no kinematics or muscle activity were collected. Individual responses ranged from plus 10.3 percent to minus 11.3 percent, which is a reminder that group means hide large individual variation in this literature.
Verification. Full text reviewed, open access. Citation verified against the publisher record.
Kyne H, Cronin JB. Beyond Jump Height: Load-Dependent Effects of Lightweight Wearable Resistance on Countermovement and Drop Jump Biomechanics. Applied Sciences. 2026;16(17):8433. doi:10.3390/app16178433
Why it matters here. The methodological warning this guide reports. Twenty trained male athletes jumped with lower-body loads of 0, 2, 4, and 6 percent of body mass. At the lowest load, countermovement depth fell 7.7 percent and drop-jump ground contact time rose 8.2 percent, while jump height was statistically unchanged. The movement strategy changed before the performance outcome did.
Use with care. Jumping, not throwing, and a leg load. Its value here is the principle rather than the numbers: an unchanged output metric is not evidence of an unchanged movement pattern.
Verification. Full text reviewed, open access. Citation verified against the publisher record.
Fukunaga T, Fedge C, Tyler T, Mullaney M, Schmitt B, Orishimo K, McHugh M, Nicholas S. Flexor-Pronator Mass Training Exercises Selectively Activate Forearm Musculature. International Journal of Sports Physical Therapy. 2023;18(1):208-214. doi:10.26603/001c.68073
Why it matters here. The activation evidence behind Section 10. Ten healthy adults performed elastic-band exercises at moderate perceived effort while surface electromyography recorded three forearm muscles. Resisted forearm pronation produced about 73 percent of maximum in the pronator teres and about 64 percent in the flexor digitorum superficialis. Resisted wrist movement toward the little finger produced about 40 percent in the flexor carpi ulnaris. Each exercise loaded a different part of the group.
Use with care. Ten healthy adults averaging 36 years of age, not throwers and not in a season. Activation is not adaptation: a high percentage during a repetition says nothing about what weeks of the exercise change. The loads were elastic bands at moderate effort, not the heavier leveraged loads some products allow.
Verification. Full text reviewed. Citation and eight-author list verified against the Crossref record for the DOI.
Otoshi K, Kikuchi S, Kato K, Kaneko Y, Mashiko R, Sato R, Igari T, Kaga T, Konno S. The role of the flexor pronator muscles as dynamic stabilizers against elbow valgus stress in patients with medial ulnar collateral ligament insufficiency. Journal of Shoulder and Elbow Surgery. 2022;31(4):694-698. doi:10.1016/j.jse.2021.10.015
Why it matters here. The clearest demonstration that contracting these muscles closes the joint in a living thrower. Eighteen baseball players with a deficient ligament, ages 14 to 28. Under a sideways load the gap at the inner elbow measured 5.1 plus or minus 1.0 millimeters on the affected side and narrowed to 3.1 plus or minus 0.9 during held forearm pronation. The healthy side went from 3.2 to 2.6 millimeters. Pain disappeared in all 18 during pronation.
Use with care. Eighteen already-symptomatic players, a manually applied rather than instrumented load, and an acute contraction rather than a training effect. That a muscle action closes a joint during an examination does not show that training that muscle changes anything across a season, and relief during a test is not treatment.
Verification. Published abstract reviewed. Citation and nine-author list verified against the Crossref record for the DOI.
Tajika T, Oya N, Ichinose T, Hamano N, Sasaki T, Shimoyama D, Shitara H, Yamamoto A, Kobayashi T, Sakamoto M, Takagishi K, Chikuda H. Flexor pronator muscles’ contribution to elbow joint valgus stability: ultrasonographic analysis in high school pitchers with and without symptoms. JSES International. 2020;4(1):9-14. doi:10.1016/j.jses.2019.10.003
Why it matters here. The same effect in a larger group closer to this guide’s readers. Eighty-nine high-school pitchers, mean age 16.5. The joint measured 2.8 millimeters at rest, opened to 3.7 under a gravity load, and returned to 2.8 with finger flexion and wrist movement toward the little finger, and to 2.7 with pronation. Every contraction pattern reduced the opening and no pattern was meaningfully better than another.
Use with care. A single session with a gravity-applied load, not pitching. The near-identical results across contraction patterns are both the useful finding and the limit: they support loading the group and give a coach no basis for preferring one exercise.
Verification. Full text reviewed. Citation and twelve-author list verified against the Crossref record for the DOI.
Lin F, Kohli N, Perlmutter S, Lim D, Nuber GW, Makhsous M. Muscle contribution to elbow joint valgus stability. Journal of Shoulder and Elbow Surgery. 2007;16(6):795-802. doi:10.1016/j.jse.2007.03.024
Why it matters here. One of the two cadaver studies ranking the flexor carpi ulnaris first. Eight fresh-frozen elbows, each muscle loaded individually at two elbow angles. The flexor carpi ulnaris gave the greatest relief of ligament strain at both angles, the flexor digitorum superficialis and flexor carpi radialis each gave significant relief, and the pronator teres produced no significant change. Two forearm extensor muscles increased strain.
Use with care. Eight elderly cadaveric specimens, static loads, fixed angles. It establishes which muscles can contribute and in what order under those conditions, not what happens in a pitch.
Verification. Published abstract reviewed. Citation and six-author list verified against the Crossref record for the DOI.
Udall JH, Fitzpatrick MJ, McGarry MH, Leba TB, Lee TQ. Effects of flexor-pronator muscle loading on valgus stability of the elbow with an intact, stretched, and resected medial ulnar collateral ligament. Journal of Shoulder and Elbow Surgery. 2009;18(5):773-778. doi:10.1016/j.jse.2009.03.008
Why it matters here. The cadaver study that disagrees about the ranking, and the reason this guide reports the ranking as unsettled. Eight elbows were tested with the ligament intact, stretched, and removed. Loading the forearm group reduced the valgus angle in every condition, and unloading the flexor digitorum superficialis increased the angle across all conditions, which led the authors to call it the largest contributor of the group.
Use with care. Eight elderly specimens, and a direct disagreement with the two studies that rank the flexor carpi ulnaris first. This guide reports the disagreement rather than choosing a side.
Verification. Published abstract reviewed. Citation and five-author list verified against the Crossref record for the DOI.
Ikezu M, Edama M, Matsuzawa K, Kaneko F, Shimizu S, Hirabayashi R, Kageyama I. Morphological Features of the Ulnar Collateral Ligament of the Elbow and Common Tendon of Flexor-Pronator Muscles. Orthopaedic Journal of Sports Medicine. 2020;8(9):2325967120952415. doi:10.1177/2325967120952415
Why it matters here. The likely explanation for why the cadaver rankings disagree. In 56 elbows, the ligament’s main bundle could be separated from the forearm tendons lying over it in only 52.9 percent of specimens, and the ligament was separable as a single bundle in 78.6 percent. The anatomy varies enough that isolating one muscle’s contribution may not be reliably possible.
Use with care. Elderly cadaveric specimens, and an anatomical description rather than a finding about throwers. It is offered here as a caution about the other studies, not as evidence for a coaching choice.
Verification. Full text reviewed. Citation and seven-author list verified against the Crossref record for the DOI.
Machida W, Nakazawa R, Abe Y, Mogi Y, Asakura T, Yamaji T, Kachi Y, Saito R, Tajika T. Relationship between forearm flexor-pronator muscles activity and medial elbow joint gapping distance during repetitive baseball pitching. JSES International. 2026;10(4):101694. doi:10.1016/j.jseint.2026.101694
Why it matters here. The pitch-count detail behind Section 3, and the source for the statement that the pronator teres is the most active of the group during pitching. Fifteen players threw 100 maximal-effort pitches with measurement every 20. The gap at the inner elbow under load rose from 4.2 to 5.0 millimeters and the increase reached significance from the sixtieth pitch onward. The flexor carpi radialis became more active between the twentieth and eightieth pitch while two other muscles did not change.
Use with care. Fifteen players in a controlled bullpen protocol rather than a game, and gapping is an indirect measure. Rising activity in one muscle is consistent with compensation but does not establish it.
Verification. Full text reviewed. Citation and nine-author list verified against the Crossref record for the DOI.
Nara M, Samukawa M, Oba K, Ishida T, Takahashi Y, Kasahara S, Tohyama H. Repetitive pitching decreases the elbow valgus stability provided by the flexor-pronator mass. Journal of Shoulder and Elbow Surgery. 2023;32(9):1819-1824. doi:10.1016/j.jse.2023.03.026
Why it matters here. The finding that the protective effect of forearm contraction itself declines with pitching. Fifteen collegiate players threw five sets of 20 pitches, with the joint measured at rest, under a sideways load, and under that load while gripping maximally, before and after. The authors concluded that recovery of forearm muscle function is part of managing ligament risk.
Use with care. Fifteen players in one session. This guide reports the direction of the finding and no numbers from it, because the millimeter values could not be obtained at the review level reached.
Verification. Published abstract reviewed. Citation and seven-author list verified against the Crossref record for the DOI. No numeric value is drawn from this source.
McHugh MP, Mullaney MJ. Does High Medial Elbow Stress During Pitching Compromise the Dynamic Stabilizers of the Elbow? International Journal of Sports Physical Therapy. 2023;18(4):949-957. doi:10.26603/001c.81596
Why it matters here. The source for Section 3’s point that grip strength is the wrong thing to check. Ten collegiate pitchers across 14 outings had finger flexion strength, grip strength, and elbow load measured before, immediately after, and one day later. After the six highest-load outings, middle-finger flexion fell to 88 percent of baseline and ring-finger flexion to 94 percent, and neither had fully recovered a day later. After the four lowest-load outings both rose above baseline. Grip strength showed no difference between the two groups.
Use with care. Ten Division III pitchers and 14 performances, with a strength measure rather than an injury outcome. It shows that a deficit exists and does not show that the deficit causes anything.
Verification. Full text reviewed. Citation and two-author list verified against the Crossref record for the DOI.
Lopez RD, Perez AR, Mehta N, Imam N, Cherian C, Alberta FG, Boergers RJ, Erickson BJ. The effect of a forearm-strengthening program on medial elbow gapping in collegiate baseball pitchers. JSES Reviews, Reports, and Techniques. 2025;5(4):751-759. doi:10.1016/j.xrrt.2025.08.010
Why it matters here. The only training study of forearm work in baseball pitchers, and the most important negative result in this guide. Fourteen Division I pitchers completed 22 sessions across eight weeks: dumbbell wrist flexion and extension, and a sledgehammer for pronation and supination and for side-to-side wrist movement, progressed by moving the hand along the handle. Forearm girth rose from 29.21 to 29.52 centimeters and peak grip from 5.67 to 5.85 newtons per kilogram. The gap at the inner elbow measured 4.51 millimeters before and 4.44 after under gravity, and 4.94 before and 4.84 after under an applied load. Neither change was significant.
Use with care. Fourteen pitchers with the non-throwing arm as a comparison rather than a control group, eight weeks, and no injury, velocity, or valgus-load outcome. A null result in 14 athletes does not prove the training does nothing. It does mean the protective claim has now been looked for once and not found.
Verification. Full text reviewed, read directly, including the protocol table. Citation and eight-author list verified against the Crossref record for the DOI.
Erickson BJ, Buchheit P, Rauch J, Ciccotti MG, Paul RW, Cohen SB. Is There a Relationship Between Grip Strength and Injuries in Professional Baseball Players? Orthopaedic Journal of Sports Medicine. 2024;12(7):23259671241257622. doi:10.1177/23259671241257622
Why it matters here. Grip strength did not distinguish injured from uninjured pitchers. Two hundred thirteen professional pitchers in one organization had grip measured after every appearance across a season, and 53 sustained a shoulder or elbow injury. Mean grip was 148.2 pounds in the injured group and 142.6 in the uninjured, not a significant difference, and the seasonal change in grip did not differ either.
Use with care. One organization and one season, and only four of the injuries involved the ulnar collateral ligament, so the study is not powered to say anything about that ligament in particular. A published letter to the editor contests the paper; that letter was not retrieved for this review.
Verification. Full text reviewed. Citation and six-author list verified against the Crossref record for the DOI.
Tajika T, Oya N, Ichinose T, Shimoyama D, Sasaki T, Hamano N, Shitara H, Yamamoto A, Takagishi K, Chikuda H. Relationship between the elbow joint valgus instability and forearm flexor muscle strength in high school pitchers with and without symptom. Journal of Orthopaedic Surgery. 2019;27(1):2309499019832664. doi:10.1177/2309499019832664
Why it matters here. The same absence of a relationship at high-school level. One hundred thirty-two pitchers, 60 with a history of elbow pain and 72 without. Neither grip strength nor flexor carpi ulnaris strength differed between the groups, and neither correlated with how far the joint opened under a sideways load. Both correlated weakly with a self-rated pitching performance score.
Use with care. A pain history is not an injury diagnosis and a self-rated score is not performance. The reported correlations of about 0.25 account for roughly 6 percent of the variation, which is a signal a coach cannot act on for one athlete.
Verification. Full text reviewed. Citation and ten-author list verified against the Crossref record for the DOI.
van Trigt B, Galjee E, Hoozemans MJM, van der Helm FCT, Veeger DHEJ. Establishing the Role of Elbow Muscles by Evaluating Muscle Activation and Co-contraction Levels at Maximal External Rotation in Fastball Pitching. Frontiers in Sports and Active Living. 2021;3:698592. doi:10.3389/fspor.2021.698592
Why it matters here. The measurement behind Section 6’s caution about reciprocal inhibition. Eleven experienced pitchers threw 15 maximal-effort fastballs each. At maximum shoulder external rotation the biceps worked at about 30 percent of maximum, the triceps at about 34 percent, and the pronator teres at about 33 percent, with the biceps and triceps active together. The authors concluded that the forearm flexor and extensor groups co-contract to stabilize the elbow and may reduce ligament stress.
Use with care. Eleven pitchers, and the values are reported at maximum external rotation rather than at ball release, so this study does not measure the instant the practitioner argument is about. It is the closest available measurement, not a direct answer to it.
Verification. Full text reviewed. Citation and five-author list verified against the Crossref record for the DOI.
Graduate research
Post EG. Correlation of Shoulder and Elbow Kinetics with Ball Velocity in College Baseball Pitchers. Master’s thesis, Illinois State University, School of Kinesiology and Recreation, 2014.
Why it matters here. A usefully large graduate sample on the relationship between throwing hard and the loads this guide is about. Sixty-seven NCAA Division I pitchers, average age 19.5, captured by eight cameras at 240 hertz with radar. Ball velocity correlated with shoulder distraction force at r equals .26 and P equals .02, with elbow valgus torque at r equals .20 and P equals .05, and with shoulder external rotation torque at r equals .10 and P equals .22.
Use with care. Graduate research carries less weight than a peer-reviewed trial. Cross-sectional, asymptomatic Division I pitchers only, and the correlations are weak: velocity explains a small share of the variation in load. It measured no strength and tested no intervention.
Verification. Full text reviewed, through the institutional repository.
Evans NA. Clinical Measurements of the Posterior Shoulder Endurance Test. Doctoral dissertation, University of Kentucky, 2020.
Why it matters here. The fullest single account of how the test is administered and scored, including the stopping criteria this guide describes, and an explicit statement that the versions tested in its later chapters are the isometric ones.
Use with care. A dissertation rather than a peer-reviewed article, in clinical rather than athletic populations, and its own limitations note that no diagnostic imaging confirmed the presence or absence of rotator cuff pathology and that the painful sample may not generalize.
Verification. Full text reviewed through the institutional repository.
Taylor E. Scapular Stabilizer Muscle Force Output in Collegiate Softball Players Over the Course of a Fall, Non-traditional Season. Undergraduate honors thesis, Otterbein University, Department of Health and Sports Sciences, 2020.
Why it matters here. The within-athlete seasonal argument in Section 5. Eleven Division III softball players completed testing at three points across a fall season, each serving as her own control, measured by hand-held dynamometry at five positions alongside a self-reported function questionnaire. All five force measures decreased significantly from before the season to after at P below .001, while the function score did not change.
Use with care. An undergraduate thesis, not peer-reviewed. Eleven athletes, one sport, one school, all positions rather than pitchers, and inconsistent testing attendance is listed among its own limitations. It is cited here as a directional caution and not as a finding about baseball pitchers.
Verification. Full text reviewed through the institutional repository.
Referenced here, developed further elsewhere
Hattori et al. on the high-school pitcher elbow response after 100 pitches, and the collegiate recovery literature on the medial elbow, are owned by What Actually Happens After You Pitch?, which reports their populations, findings, and limits. Cross-referenced here and not restated.
Mullaney MJ, McHugh MP, et al. Upper and lower extremity muscle fatigue after a baseball pitching performance. The American Journal of Sports Medicine. 2005;33(1):108-113.
Why it matters here. In 13 pitchers tested with a handheld dynamometer before and after 19 games (about 99 pitches), dominant-arm strength fell 18 percent in internal rotation, 15 percent in shoulder flexion, and 11 percent in adduction, with minimal change in scapular stabilizers and hips.
Use with care. Small sample, handheld testing, and none of the declines are in the muscles that stop the arm. External rotation was not reported in the abstract reviewed. The author list on the record read was incomplete, so confirm it before publishing.
Verification. Published abstract reviewed.
Superior labral strain during the throwing motion: a cadaveric study. The American Journal of Sports Medicine. 2001 (July issue). PMID 11476391.
Why it matters here. In 10 cadaveric shoulders loaded to simulate pitching phases, strain on the superior labrum rose significantly only in late cocking, at maximal external rotation, and more at the back of the labrum than the front.
Use with care. Cadaver model with spring-applied loads. Authors, volume, and pages were not on the record read, so confirm before publishing. It does not test deceleration directly, and the abstract reports no significant strain in deceleration or follow-through.
Verification. Published abstract reviewed.
Practitioner sources
Wolforth R. Wolforth Throwing Mentorship: Article 28. Perfect Game. Published March 22, 2023. https://www.perfectgame.org/articles/view.aspx?article=21786
Why it matters here. Wolforth’s published position that deceleration is a trainable capacity and a prerequisite for velocity. Step 3 of seven steps for adding velocity in-season is to become a more effective and efficient decelerator, quoting Mike Marshall’s claim that the body will only accelerate as efficiently as it can decelerate, and proposing that the body restricts acceleration when it judges that the arm cannot be stopped safely. Names three low-intensity tools, the Durathro Sock, the bell club, and the Handspeed Trainer, and says deceleration work can be done at lower intensities within arm care, ramp-up, and post-throwing, with no counts or durations.
Use with care. Practitioner and commercial facility material, not peer-reviewed evidence. The velocity-gating mechanism has no published experimental support in pitching and Wolforth labels it a belief. His statement that only about 30 percent of pitchers show highly efficient deceleration is a recollection from more than twenty years of video review in a self-selected population, with no published criteria and no rater reliability, and should be read as an impression rather than a measurement.
Verification. Full text reviewed, read directly. Confirmed by two independent retrievals that agreed verbatim, because the host site served inconsistent content to automated retrieval during this review. An earlier draft of this guide cited article 21925 and attributed this claim to it; that page’s subject is pitch counts, and the citation was wrong.
Wolforth R. 5 Simple Steps to Increase Pitching Performance During the Season. Texas Baseball Ranch. Published June 6, 2024. https://www.texasbaseballranch.com/blog/5-simple-steps-to-increase-pitching-performance-during-the-season/
Why it matters here. The source for the statement that Wolforth names the weighted forearm sleeve in his own published material. It appears in two places. In a daily post-throwing routine of about ten minutes, the Durathro Sock, the sleeve, and the Shoulder Tube sit alongside kettlebell carries, light stretching, foam rolling, and relaxation work, described as aiding recovery. Separately, the sock and sleeve are listed as “connection tools” for refining mechanics, to be used “a little, a lot”: consistent, frequent short exposures rather than long, sporadic sessions. Healthy in-season pitchers, not a rehabilitation context.
Use with care. Practitioner and commercial facility material, not peer-reviewed evidence. The tools are named as an unordered menu with no sequence, no dose, and no stated outcome, and the recovery framing is not an outcome claim. Naming a tool is not evidence about the tool.
Verification. Full text reviewed, read directly. Note that the site’s own search index lists a different byline from the one printed on the article page; the page itself credits Coach Ron Wolforth.
Sullivan R. Eccentric Biceps Is The Devil For A Throwing Athlete. Florida Baseball ARMory. Published March 28, 2019. https://floridabaseballarmory.com/eccentric-biceps-is-the-devil-for-a-throwing-athlete/
Why it matters here. Supplies the contrasting practitioner position, that force management after release is a problem of arm path rather than of capacity. Sullivan argues that suppressing eccentric biceps activity is essential to protecting the labrum and the ulnar collateral ligament, that internal rotation and forearm pronation through the finish recruit reciprocal inhibition, and that bands, rows, and reverse throws are inadequate because they are concentric rather than eccentric. It also describes the Training Sock in detail: a canvas sleeve tethering two fingers, a 7-ounce ball, a normal full-intent throw into the end of the sock about four inches past the fingertips, with the stated effects that impact encourages shoulder internal rotation, the posterior musculature stays active through deceleration, and a longer distance would encourage a linear pattern. It is also the origin of the term first responders, which Sullivan applies to the forearm muscles near the inner elbow and which Oates uses as a product name. He writes that these muscles are commonly known as the flexor-pronator mass, that his practice refers to them as first responders, and that they represent the first link in the chain of activity necessary to protect the ligament.
Use with care. Practitioner and commercial facility material, not peer-reviewed evidence. The claim that a finish pattern turns the biceps off through reciprocal inhibition is stronger than the available physiology supports, because high-velocity throwing involves substantial antagonist co-activation and because it sits against Sullivan’s own argument elsewhere that co-contraction is what stabilizes joints. The electromyography study he cites documents biceps activity across throwing phases and does not establish that eccentric biceps activity causes labral or ligament injury. Neither limitation makes his observation about the finish wrong; both limit how confidently the mechanism can be explained. It does not validate the ARMory’s assessment methods, proprietary model, or training claims. Two further cautions. The article names four muscles in that group and omits both the pronator teres and the flexor carpi ulnaris, which are the two carrying most of the evidence, so the coinage is useful and the anatomy offered alongside it should not be cited. And the article carries an Oates Specialties affiliate code, so it is not independent commentary on an Oates product and is not treated as such here.
Verification. Full text reviewed, read directly. Note that every article on this site carries the same recent modified date regardless of publication date, which appears to be a site-wide re-dating rather than evidence of revision, so the publication date is used here.
Sullivan R. Shut It Down Or Keep Throwing? Maybe There’s An Alternative. Florida Baseball ARMory. Publication date not confirmed. https://floridabaseballarmory.com/shut-it-down-or-keep-throwing-maybe-theres-an-alternative/
Why it matters here. The source for Sullivan’s off-season use of the Training Sock. He suggests a low-intensity maintenance plan with “sub-maximal throwing using tools like the Training Sock or Connector Club,” and sub-maximal sock drills “all winter long” alongside corrective exercises, on the reasoning that light throwing during lifting keeps tissue organized along functional lines and eases the return to full throwing. The article gives no counts, sets, or sessions per week.
Use with care. Practitioner and commercial facility material, not peer-reviewed evidence. Its reasoning rests on tissue-alignment arguments that are not tested in throwers. It does not validate the ARMory’s assessment methods, proprietary model, or training claims.
Verification. Full text read directly; counts and dates not stated on the page.
Oates Education Hub
Oates Specialties. Wearable Throwing Sock: In-Season Deceleration and Arm Care Guide. Oates Specialties Education Hub. https://oatesspecialties.com/blogs/default-blog/throwing-sock-deceleration-arm-care
Why it matters here. Owns the in-season implementation pattern for confined-space, low-intent throwing with a sock. This guide points to it for implementation rather than repeating the routine.
Classification. Oates editorial content, not research. It presents no tests, screens, or peer-reviewed sources.
Verification. Full text reviewed, read directly.
Research reserved for related guides
Section 13 routes a coach to the right guide. This list records what is deliberately not developed here, so no reader mistakes an omission for a gap in the evidence: posterior-shoulder exercise selection and daily arm-care implementation; the whole-body response to a single outing and the definition of deceleration; weight-room programming and concurrent training; hip and trunk contributions to elbow loading; throwing volume, pitch counts, and workload monitoring; and weighted implements, velocity programs, and added-load throwing. Return-to-throw decision-making after injury is outside this guide’s scope and is directed by qualified professionals.
Appendix A: How to Read Measurement Research
What the review levels in the bibliography mean
| Review level | What was actually read |
|---|---|
| Full text reviewed | Methods, results, stated limitations, and the authors’ own interpretation |
| Published abstract reviewed | The abstract and the bibliographic record. No independent reading of methods or results beyond what the abstract states |
| Bibliographic record reviewed | Citation metadata confirmed. No finding used beyond what the published record states |
| Not retrieved | The source is named. No finding is drawn from it at all |
A claim in the body of this guide is only as strong as the level its source carries. Where a number rests on an abstract rather than a full text, the entry says so.
Five ideas that separate using this evidence well from misusing it
A force figure is a measurement, not a limit. A study reporting 1090 newtons after release describes what a group of skilled pitchers produced in a laboratory. It sets no safe threshold and places no individual above or below one.
A percentage of capacity is a ratio between two measurements, each with error. When fastball varus demand averages 103 percent of available strength, both numbers carry their own variation. The finding is that demand and capacity are close in size, not that a given pitcher is 3 percent short.
Minimal detectable change is the floor under any repeated measure. If a test’s minimal detectable change is 17 seconds under favorable conditions, a change of 9 seconds is not information. This is the most common way a well-intentioned coach fools himself.
A single-arm cohort cannot separate training from time. A group that improves over 20 weeks without a comparison group may have improved from the program, from maturation, from the season, or from learning the test. All four are live.
A simulation or a cadaver establishes mechanism, not effect. A model showing that stronger muscle reduces computed ligament load is a statement about the model. Neither it nor a cadaver study is a training result.
Appendix B: Where Each Claim Comes From
| Claim in the guide | Section | Source |
|---|---|---|
| Large compressive, posterior, and horizontal abduction loads occur after ball release | Summary, 3 | Fleisig et al., 1995 |
| Muscle activity and joint loads are greatest in cocking and deceleration | Summary, 3 | Escamilla and Andrews, 2009 |
| Peak shoulder internal rotation velocity occurs after release in professionals | Summary, 3 | Aguinaldo and Escamilla, 2019 |
| Fastball varus demand averaged about 103 percent of available varus strength | Summary, 4 | Yanai et al., 2025 |
| Ten of 22 pitchers could not fully unload the ligament | Summary, 4 | Yanai et al., 2025 |
| Varus strength fell about 10 percent across seven innings while load held constant | Summary, 4 | Yanai and Onuma, 2026 |
| The muscular margin present in the first inning was absent later | Summary, 4 | Yanai and Onuma, 2026 |
| The landing leg resists about 0.72 body weight | 3 | MacWilliams et al., 1998 |
| Trunk variables predicted about 68 percent of elbow valgus torque variation | 3 | Aguinaldo and Escamilla, 2019 |
| Trunk flexion and rotation associated with less shoulder internal rotation at maximum internal rotation | 3 | Aso and Kagaya, 2024 |
| Posterior-shoulder endurance rose from 30 to 66 to 88 repetitions over 20 weeks | Summary, 3, 8 | Moore et al., 2013 |
| Range of motion and rotational strength ratio did not change in that program | 3 | Moore et al., 2013 |
| Preseason strength findings do not agree across populations | 4 | Byram et al., 2010; Tyler et al., 2014 |
| No study has trained varus strength and re-measured ligament load | 4 | Buffi et al., 2015; Park and Ahmad, 2004 |
| Minimal detectable change for the isometric test is about 17 seconds | 5 | Evans et al., 2021 |
| The 90-degree position is the more useful of the two | 5 | Evans et al., 2018 |
| Three incompatible test protocols exist | 5 | Moore et al., 2013; Evans et al., 2018 |
| Scapular force declined across a fall season while reported function did not | 5 | Taylor, 2020 |
| Ball velocity correlates only weakly with shoulder distraction force | 3 | Post, 2014 |
| Forearm-hand inertia mediated the relationship between valgus load and throwing inefficiency | 10 | Tsutsui et al., 2024 |
| Varus strength is not a measure of whole-body deceleration capacity | 3, 4 | Stated as a limit of Yanai et al., 2025, not a finding |
| No study has tested an added forearm load as heavy as sixteen ounces during throwing | 4, 10 | Absence of evidence at that load; the studied range is 50 to 500 grams |
| Light attached limb loads overload joint angular velocity with small mean changes in joint angle | 10 | Feser et al., 2023 |
| Movement-specific overload is the stated rationale for wearable resistance | 10 | Macadam et al., 2017 |
| Pitch-phase timing did not change under 100 to 200 gram arm loads | 10 | Job et al., 2025 |
| Loads below the elbow reduced velocity and arm speed; loads above it did not | 10 | Job et al., 2025 |
| Forearm loads left muscle activity, joint angles, timing, and accuracy unchanged | 10 | Fredriksen and van den Tillaar, 2022 |
| Six weeks of progressive forearm loading raised throwing velocity about 4 percent | 10 | Fredriksen and van den Tillaar, 2025 |
| Two throwing programs with forearm or arm loading were null | 10 | Mielniczek et al., 2025; a 2025 collegiate pitching pilot |
| Movement strategy can change at a load where the performance outcome does not | 10 | Kyne and Cronin, 2026 |
| Wolforth names both the sleeve and the sock in his published in-season material | 6, 7, 10 | Wolforth, 2024 |
| Contracting the forearm muscles narrowed the gap at the inner elbow in living throwers | 4 | Otoshi et al., 2022; Tajika et al., 2020 |
| Which forearm muscle contributes most is unsettled | 4 | Park and Ahmad, 2004; Lin et al., 2007; Udall et al., 2009; Machida et al., 2026 |
| The ligament can be separated from the forearm tendons over it in about half of specimens | 4 | Ikezu et al., 2020 |
| Eight weeks of forearm strengthening did not change the gap at the inner elbow | 4, 10 | Lopez et al., 2025 |
| Grip and forearm strength did not distinguish injured from uninjured pitchers | 4 | Erickson et al., 2024; Tajika et al., 2019 |
| Repeated pitching reduced the protective effect of forearm contraction | 3 | Nara et al., 2023 |
| The gap at the inner elbow widened from the sixtieth pitch onward | 3 | Machida et al., 2026 |
| Finger flexion strength fell after high-load outings while grip strength did not | 3 | McHugh and Mullaney, 2023 |
| Resisted pronation produced the highest measured forearm activation of the exercises tested | 10 | Fukunaga et al., 2023 |
| Biceps and triceps are active together at maximum shoulder external rotation | 6 | van Trigt et al., 2021 |
| The leveraged implement used in the only forearm training study matches one product category | 10 | Lopez et al., 2025 |
| Wolforth names the sock for deceleration work at lower intensities in arm care, ramp-up, and post-throwing | 6, 7 | Wolforth, 2023 |
| Wolforth places the sock in a roughly ten-minute post-throwing routine and calls it a connection tool | 7 | Wolforth, 2024 |
| Sullivan describes the sock as a contained 7-ounce full-intent throw that cues internal rotation | 7 | Sullivan, 2019 |
| Sullivan describes sub-maximal sock drills through the off-season | 7 | Sullivan, Shut It Down |
| Post-game strength fell in shoulder internal rotation, flexion, and adduction | 4 | Mullaney et al., 2005 |
| Superior labral strain rose only in late cocking in a cadaver model | 6 | Cadaver study, 2001 |
| The first responders term is Sullivan’s own name for the forearm muscle group | 10 | Sullivan, 2019 |
Appendix C: Terms Used in This Guide
Arm deceleration phase. The portion of the pitch beginning at ball release, during which the throwing arm slows into the follow-through.
Compressive force. Force pushing the surfaces of a joint together. Reported at the shoulder after release.
Distraction force. Force pulling a joint apart. At the shoulder after release, the muscles resist it.
Eccentric contraction. A muscle producing force while lengthening. Much of the work of slowing the arm is eccentric. A concentric contraction is the opposite, producing force while shortening.
Co-contraction. Muscles on opposite sides of a joint activating together, which stiffens and stabilizes the joint.
Valgus load. At the elbow, loading that tends to force the joint open along its inner side. The ulnar collateral ligament, commonly abbreviated UCL, resists it.
Varus strength. The muscular capacity to resist the elbow being forced open. This guide calls it the muscular margin, and it is the quantity that fatigues during an outing. It is a measure at one joint in one direction, not a score for a pitcher’s overall ability to slow the arm down.
Stress shielding. Muscle taking load that would otherwise be carried by a ligament.
Flexor-pronator mass. The forearm muscles originating near the inner elbow. Cadaveric work identifies the flexor carpi ulnaris as the primary dynamic contributor to valgus stability.
Pronation and supination. Rotation of the forearm. Pronation turns the palm downward and the thumb inward; supination turns it the other way. The muscles that pronate the forearm originate near the inner elbow.
Medial elbow gapping. How far the inner side of the elbow opens when a sideways load is applied, measured by ultrasound in millimeters. Researchers use it as an indirect indicator of how much the ligament and the muscles around it are resisting. It is a research measurement, not a coaching test.
Leveraged weight. Resistance produced by holding a weight at a distance from the hand rather than in it, as with a sledgehammer or a cantilevered bar. Moving the hand along the lever changes the effective load without changing the weight.
Newton, newton-meter. A newton is a unit of force. A newton-meter is a unit of torque, or rotational effort: force multiplied by distance from the axis.
Percent of maximum voluntary isometric contraction. How hard a muscle is working in electromyography research, relative to its own maximum effort. Abbreviated MVIC.
Posterior Shoulder Endurance Test. A repeated or sustained shoulder task in the prone position used to estimate endurance of the muscles behind the shoulder. Three incompatible protocols share the name.
Minimal detectable change. The smallest change in a measurement that can be distinguished from measurement error with reasonable confidence. Related terms: the intraclass correlation coefficient describes how consistently a measurement repeats, and the standard error of measurement describes the typical error around a single result.
Relative risk. How many times more often an outcome occurs in one group than another. A confidence interval crossing 1 means the result is compatible with no difference.
Mediation. When the relationship between two variables is explained by a third.
Percent of pitch cycle. A way of locating an event in time within a pitch. A value above 100 percent means the event occurred after ball release.
Wearable resistance. A research term for light loads attached to a limb during a sport movement, on the reasoning that loading the movement is different from loading the same muscles in a separate exercise. Most of the published work is in sprinting; a small number of studies apply it to throwing.
Appendix D: The Deceleration Observation Record
For one athlete, one fall. This is a coaching record, not a medical document, and nothing in it diagnoses or clears anyone.
| Step | Prompt | Notes |
|---|---|---|
| Task observed | What shoulder or throwing task did you watch, and why that one? | |
| Conditions | Day of week, position in the session, throwing already completed, who ran it | |
| Early result | What did it look like at the start of the session? | |
| Late result | What did it look like at the end, or after the throwing? | |
| Comparison | How does that compare with this athlete’s own previous result under the same conditions? | |
| Athlete report | What did he say about feel, and did anything change from his normal? | |
| Plan change | What one demand did you change as a result, if any? | |
| Hold criteria | What would make you hold or simplify that demand? | |
| Next decision | What are you watching for, and when will you look? |
Qualified professionals evaluate, diagnose, interpret clinical findings, and determine medical clearance. A coach asks, records, notices, monitors, adjusts, coordinates, and refers.
About This Analysis
Created by the Oates Specialties team led by Robert Oates, M.Ed., Founder
Editorial oversight by Gunnar Thompson, BS, CSCS, General Manager
Certified Strength & Conditioning Specialist | Biomechanics Specialist
October 2026
Complete Credentials
ROBERT OATES, M.Ed., Founder: Founded Oates Specialties in 2003. Master of Education degree. Provides strategic direction for educational content and athlete development philosophy.
GUNNAR THOMPSON, General Manager: BS Kinesiology (Clinical Exercise Science). CSCS (NSCA), PES (NASM), CPPS certifications. Technical authority on biomechanics and performance science. Conducts review of all educational content for scientific accuracy.
Questions or corrections: gunnart@oatesspecialties.com
© 2026, Oates Specialties LLC