How Do Pitchers Safely Add Velocity?
What a fall block can realistically build, what a radar gain cannot prove, and why added speed requires a new exposure review
From Fall to Opening Day · Oates Specialties · November 2026
This guide is written primarily for coaches of male baseball pitchers from junior high through college. Some cited research uses collegiate or professional pitchers, and conclusions do not automatically carry across ages or levels. This is preparation guidance, not medical advice, injury prediction, rehabilitation, or clearance to throw. Coaches observe, record, adjust, coordinate, and refer. Qualified professionals diagnose, interpret clinical findings, and determine medical clearance.
Executive Summary: The Coaching Answer on Velocity
Pitchers can add velocity. Controlled studies show that dynamic trunk-and-hip work, rotational power training, and progressive throwing can raise measured throwing speed over six to eight weeks in some groups. The gain is usually modest. It is not guaranteed.
A radar gain is an outcome, not a verdict on readiness. The best professional study found that elbow torque predicted later ligament surgery, but fastball velocity did not. A high-school training study then showed the trade: pitchers who gained speed also showed higher elbow loading. Neither result is a safety formula. Both are reasons to manage a gain, not just celebrate it.
This guide gives a coach eight steps and one example set up. The steps cover naming the limiting problem, recording a baseline, setting the week, building mobility, stability, strength, and power, adding one weighted-ball session, retesting, and reviewing exposure when velocity rises. The example shows a full eight-week block a coach could start from.
Find Your Answer
Answer the question closest to what you need right now, and jump straight there.
- “Does throwing harder predict elbow surgery?” → Jump to: Velocity alone did not predict elbow surgery
- “Can a fall block actually add velocity?” → Jump to: What training can build
- “What should I record before the block starts?” → Jump to: Step 2: Record a baseline
- “What should I do when velocity goes up?” → Jump to: Step 8: When velocity rises, review exposure before adding work
- “What does a full eight-week block look like?” → Jump to: Example Set Up: Eight Weeks at a Glance
🎧 Prefer to listen? Audio version of this article:
The Coaching Problem and the Short Answer
A pitcher arrives in November with a screenshot: six weeks, five miles per hour, a testimonial from someone a year older. He wants to know whether to do the program. Training can help some athletes throw harder. The advertised result still does not tell a coach what to do next.
Velocity tempts coaches to stack stress on top of a good training block: extra bullpens, harder catch play, new implements, a heavier lifting phase, a showcase. Then no one can say which demand changed the athlete’s response.
The short answer has three parts:
- Build rotational power through the trunk and hips. Dynamic work has the clearest short-term evidence.
- Keep throwing in the plan, and organize it. One weighted-ball session per week can serve as the high-output throwing push. The rest of the week needs to support it.
- Judge the athlete against himself. Radar is a poor way to compare two pitchers’ internal demand. It is more useful across several comparable outings for one pitcher, alongside exposure, recovery, and a capacity task.
In this series, capacity is what the athlete has built, and expression is what he shows in competition. Velocity is expression. A radar gain can come from training, growth, more throwing, extra effort, or a better day, so a teenager may be training well and growing at the same time.
What the Research Shows and What It Does Not
Velocity alone did not predict elbow surgery
The best study of this question followed 305 drafted professional pitchers for up to about four and a half years. Thirty-one had elbow-ligament surgery. Fastball velocity did not predict who they were. Elbow varus torque did. That is the twisting force on the inside of the elbow during a throw, measured in a motion-capture lab. Pitchers with higher torque at the start were more likely to have surgery later.
The finding has limits. Each pitcher was measured once, the link faded when torque was adjusted for body size, and the athletes were professionals. It gives no threshold for a high-school pitcher.
Radar is not a load meter. Within one pitcher, throwing harder usually goes with more elbow torque. Across pitchers the link is much weaker, because body size and movement differ. A radar number says how fast the ball left the hand, not how hard the arm worked.
A faster arm can carry more load
In an eight-week study of high-school pitchers, a supervised trunk-and-hip program raised ball speed compared with a control group. Torque at the elbow rose with it. The authors found no meaningful differences between the groups in the delivery changes they measured. A delivery that changes little does not mean the extra speed came free. The study did not track injuries.
What training can build
A seven-week randomized trial of 46 collegiate athletes compared rotational power training with static core endurance. The rotational group gained about 3.4 miles per hour in peak throwing speed. The endurance group did not, though both improved at planks.
The successful programs in this research used ordinary equipment: medicine balls, tubing, dumbbells, and explosive actions. They moved from control to strength to power to speed. That is a reasonable fall program. It does not identify the best exercise, dose, or schedule.
What remains unsettled
- No study shows how much to cut throwing after a velocity gain to minimize stress.
- Most trials last four to 12 weeks, and results are mixed.
- Only one of 16 reviewed resistance-training studies reported injury outcomes, so training cannot be presented as arm protection.
The research gives a direction: build dynamic power, keep throwing visible, and judge each athlete against himself. It does not give a schedule. Practitioners who work with pitchers every day fill that gap.
Practitioner Use: Ron Wolforth, Jill Wolforth, and Randy Sullivan
Ron Wolforth, Jill Wolforth, and Randy Sullivan work in different facilities. Their public material points the same way. Assess the athlete before prescribing. Build several qualities together instead of relying on one tool. Organize force and effort instead of simply adding them. Protect recovery. This guide uses their frameworks as applied examples of how the research could be put into practice.
Ron Wolforth describes assessment before prescription: assess the athlete, categorize what is limiting him, customize the plan, and build a short block around it. His ideal week has two heavy days, two medium days, and two light days. Each heavy day is followed by a light day, and heavy days sit at least 48 hours apart. He calls the heavy days pushes. He also lists habits he rates as ideal: eight to nine hours of sleep, steady hydration, a long and gradual ramp-up, and at least a quarter of weekly efforts made with deliberate, explosive intent.
Jill Wolforth, writing for the Texas Baseball Ranch, describes velocity as the product of several factors working together: intent, skill-specific strength, mobility, coordination, posterior-chain contribution, recovery, and feedback. No single implement is the answer.
Randy Sullivan focuses on how force is applied through the delivery. His public work stresses that timing, direction, and use of the lower half matter as much as how much force the athlete makes. His explanations rest on proprietary force-plate work.
Commercial transparency: Texas Baseball Ranch and Florida Baseball ARMory are commercial businesses with working relationships with Oates Specialties, and they use Oates products. Oates sells training equipment and has a commercial interest in equipment use. These frameworks are practitioner interpretation, not trial results or product-specific proof. This guide provides equipment-provider education, not individualized coaching or medical care.
How to Build a Fall Velocity Block: Step by Step
Work through the steps in order. The example set up that follows shows the whole block with tools, sets, and reps.
An example, not a tested protocol. This is Oates Specialties’ example of how a coach could put the research and practitioner frameworks into practice. No study supports these exact sets, reps, loads, throw counts, or timing. The tools named are examples of tasks, not proof that a product produces a result. Supervise the work, adjust it for the athlete, and refer symptoms to a qualified professional.
Who it is for: Pitchers 13 and older with a repeatable delivery and an established fall throwing plan. Younger athletes are a separate conversation.
Step 1: Name the limiting problem
Start with the biggest gap, not the biggest program. Look at where this athlete is limited: a specific mobility position, stability or control, lower-body or trunk strength, rotational power, or throwing exposure. The Audit in this series covers how to find the floor and the runway. What a Mobility Screen Actually Tells You covers how to read test positions.
The block below includes mobility, stability, strength, power, and throwing for every athlete. The named problem sets the emphasis. A pitcher limited by hip range spends more of the circuit on hips. A pitcher with a flat rotational score spends more of the gym on power. If a screen or a session shows pain, weakness, numbness, or locking, stop and refer. That is outside coaching.
Step 2: Record a baseline
Take three records before the block starts.
- Velocity in a planned session, not an added maximal one.
- A rotational task score (described below).
- A two-week throwing record, counting every meaningful throw and the high-intent ones separately.
Radar is one signal among several. Ball speed shows expression, exposure shows what the athlete absorbed, and recovery shows whether he tolerated it. None of them diagnoses anything.
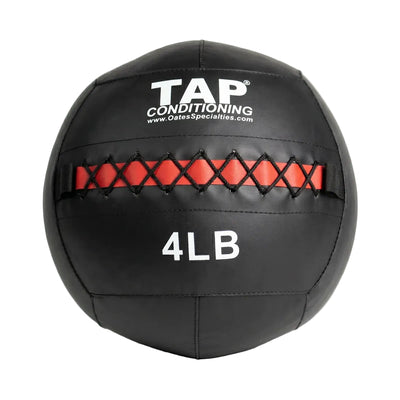
The rotational task (Oates Specialties’ example). Choose one rotational throw with a TAP® Soft Medicine Ball, such as a side or shot-put throw into an open space. Throw at full intent. Use the same ball, stance, and setup each time. Decide in advance whether you score the best of three or the average, and do not switch after seeing the scores. Test at Week 1, Week 4, and Week 8, on a rested day. No source establishes a minimal detectable change for this task, so look for a consistent trend, not a few inches from one session.
Keep radar comparable. Use the same device, placement, pitch type, setting, warm-up, and intended effort. Label mound, flat-ground, game, and pull-down readings separately.
Step 3: Set the week
Keep the athlete’s existing throwing schedule and fit the pushes around it. Label each day heavy, medium, or light. Place two heavy days at least 48 hours apart, and follow each with a light day. In this block the weighted-ball session is the first push. A bullpen, live session, or game is the second.
Before each push, run a readiness check. These questions are a suggestion, not a screen:
- Did the athlete sleep normally the last two nights?
- Does his arm feel normal in daily movement, not just in warm-up?
- Did he recover from the last push without lingering fatigue?
If any answer is no, keep the day medium or light and push later in the week. Do not stack a push on a tired arm.
Step 4: Open every session with mobility and stability
Start both gym sessions with a short circuit. On light days, the circuit is the whole session. The circuit loads the same positions that mobility screens check, using light weights and bands. Keep the load light and the pace slow. Judge each rep by how well the athlete controls the position, not by how far he reaches.
This work is practice, not a retest, because screens are scored unloaded. Both the practitioner frameworks and the reasoning in What a Mobility Screen Actually Tells You support including it. The research in throwers is thin, so treat the circuit as a way to practice control, not a way to gain range.
Step 5: Build strength and rotational power in the gym
Run two gym sessions a week, about 40 minutes each. Use the research shape: control first, then strength, then power, then speed.
- Gym A is strength and rotational power. It is the heavier of the two.
- Gym B is power and shoulder stability. It keeps arm demand lower because a push follows two days later.
- Throw every counted rotational rep with full intent from Week 1. Take two build-up throws at about half effort first. Intent stays high the whole block. What builds across the block is the number of sets and the ball weight, not the effort.
- Keep reps low and rest full so each throw is fast. The power reps in the research were about one to four.
- Change one major demand per step. Build the gym in Weeks 1–4. Hold it steady in Weeks 5–6 while the weighted-ball push enters. Cut volume and ask for speed in Weeks 7–8.
Step 6: Add the weighted-ball push
The weighted-ball session enters in Weeks 5–6 as the first push. The 4-to-7 Ounce Range in this series covers the evidence in full. In short, older training studies using balls near 4 to 6 ounces reported velocity gains, and a mound study found no measured increase in arm stress at 4 to 6 ounces and lower values at 7 ounces.
The limits matter. No study has combined the full range, a mound, and a multi-week design. The stress values come from single sessions. One randomized trial of young pitchers reported four elbow injuries in the training group, but it used different implements and running approaches, so it does not test this set. It is a reason to progress conservatively, not a verdict on the range.
How the push is set up (Oates Specialties’ example):
- Ramp first. Warm up as usual, then throw regulation-ball catch before any weighted ball.
- Stationary throws only. Use a mound or flat ground at regulation distance. The evidence flags running approaches and maximum-distance throws as the added-stress conditions.
- Start light in the range. Weeks 5–6 use 5 and 6 oz. Build effort over the session instead of starting at maximum.
- Mix weights. The older literature used a roughly 2:1 altered-to-standard convention. Our source does not say whether that counts throws or sessions, so treat it as a loose guide.
- Keep the count small and recorded. About 15 to 20 weighted throws in the first session is a reasonable starting point. Every weighted throw counts in weekly exposure.
- Stop on symptoms. Pain or unusual fatigue ends the session.
- Light day after. The push is followed by a light day.
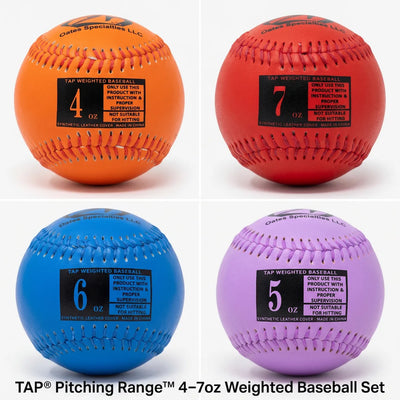
Age 13 and older is the line. A study of 19 pitchers aged 9 to 14 found elbow stress rising with ball weight, the opposite pattern. The mound study behind the 4-to-7 ounce findings averaged about 18 years old and included only pitchers with weighted-ball experience, so it does not directly cover the younger end of the 13-and-up range. There, supervise more closely and progress more slowly. Oates Specialties makes the TAP® Pitching Range™ 4–7 oz Weighted Baseball Set for this range.
Step 7: Retest and decide
At the end of Week 8, repeat the rotational task and compare velocity in a planned session. Do not add a maximal test session just to get a number. Then use the table.
| Observation | Reasonable next decision |
|---|---|
| Rotational task improves, velocity is flat, recovery holds | Continue without forcing a radar result |
| Velocity rises, exposure and recovery stable | Hold the plan long enough to see if the change repeats |
| Velocity rises, but intent or gym demand also rose | Hold or reduce one demand before adding another |
| Velocity rises, recovery worsens | Reduce exposure and stop adding demands |
| Velocity falls across comparable outings | Pause progression and review exposure, recovery, role demand, and symptoms |
Step 8: When velocity rises, review exposure before adding work
A velocity gain should change the conversation, not automatically change the weekly total. No study tells a coach how much to adjust, so the rule is to review exposure before adding work. The workload guide in this series owns the counting method. Count the whole throwing week: games, bullpens, warm-up throws, catch play, long toss, velocity work, lessons, showcases, and weighted-implement sessions. Then note what was high intent.
The one-demand rule. Do not add velocity work, a new high-effort lifting block, extra mound volume, weighted-implement throws, and a showcase in the same week. Change one major demand. Then learn whether the athlete can repeat it.
Velocity can also fall when fatigue comes from outside the throwing arm. In a crossover study of 16 adolescent pitchers, velocity declined after both upper-body and lower-body fatigue. A lower reading should trigger a whole-week review.
A sample week log, Week 6 and Week 7 (illustrative numbers):
| Week 6 | Week 7 | |
|---|---|---|
| Velocity in planned bullpen | 79 | 80 |
| Weighted-ball throws | 18 | 18 |
| Bullpens and games | 1 bullpen, 1 game | 1 bullpen, 1 game |
| Outside work | None | One private lesson, extra long toss |
| Recovery next morning | Normal | Slower than usual |
| Decision | Continue | Hold the weighted count, remove the extra long toss, recheck next week |
The velocity rise alone would have looked like permission to add more. The log shows what else changed. The coach removes the added work instead of adding a bullpen to test whether the arm is ready.
Example Set Up: Eight Weeks at a Glance
This is one way the eight steps could be set up. Change the days, tasks, and numbers to fit the athlete and the facility. No study supports these exact sets, reps, or schedule.
The week
| Day | Load | Throwing | Other work |
|---|---|---|---|
| Mon | Medium | Catch play, moderate effort | Gym A (about 40 minutes) |
| Tue | Heavy: Push 1 | Weighted-ball session from Week 5. Before that, the athlete’s usual intent throwing. | None |
| Wed | Light | Recovery catch or no throwing | Mobility and stability circuit (about 10 minutes) |
| Thu | Medium | Controlled-intent flat ground or bullpen | Gym B (about 40 minutes) |
| Fri | Light | Light catch | Mobility and stability circuit (about 10 minutes) |
| Sat | Heavy: Push 2 | Bullpen, live session, or game | None |
| Sun | Off | None | None |
If Monday’s gym leaves him tired for Tuesday’s push, move Gym A to Wednesday.
The mobility and stability circuit
Run this before both gym sessions and on Wednesday and Friday. Keep the load light and the pace slow.
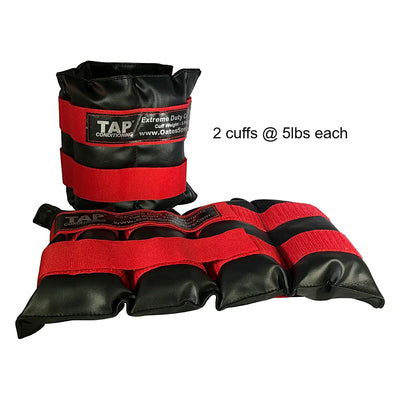
- Reciprocal shoulder reach: slow reaches with light TAP® Weighted Cuffs on the arms, 2 sets of 5 per side.
- 90/90 rotation: a TAP® Exercise Band held in the 90/90 arm position, or a light TAP® Bell Club held in both hands, during a slow rotation. 2 sets of 5 per side.
- Lower-body diagonal reach: Wrist Weights at the ankles, or an Exercise Band around the legs. 2 sets of 5 per side.
- Single-leg hold: 2 sets of 20 seconds per side, eyes forward.
Gym A: Strength and Rotational Power
| Order | Task | Weeks 1–2 | Weeks 3–4 | Weeks 5–6 | Weeks 7–8 |
|---|---|---|---|---|---|
| 1 | Mobility and stability circuit | As above | As above | As above | As above |
| 2 | Rotational throw with a TAP® Soft Medicine Ball (side or shot-put style, into a wall or open space), full intent | 3 sets of 3 per side | 4 sets of 3 per side | 4 sets of 3 per side (hold) | 3 sets of 3 per side, full rest; a lighter ball may be used to move faster |
| 3 | Split squat or lateral lunge | 2 sets of 6 | 3 sets of 6, loaded | Hold | 2 sets of 6, faster |
| 4 | Half-kneeling press with Oates Specialties Tubing and a pause (trunk control) | 2 sets of 8 per side | Chop and lift, 3 sets of 6–8 | Hold | 2 sets of 6 |
Gym B: Power and Shoulder Stability
| Order | Task | Weeks 1–2 | Weeks 3–4 | Weeks 5–6 | Weeks 7–8 |
|---|---|---|---|---|---|
| 1 | Mobility and stability circuit | As above | As above | As above | As above |
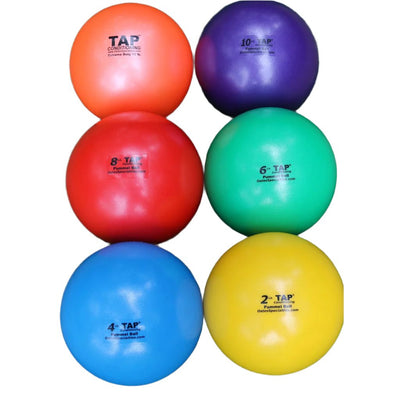
| 2 | Rotational throws and slams with a TAP® Pummel Ball (into a wall or floor), full intent | 3 sets of 3 | 4 sets of 3 | 4 sets of 3 (hold) | 3 sets of 3, full rest |
| 3 | Single-leg hip hinge | 2 sets of 6 | 3 sets of 6, loaded | Hold | 2 sets of 6 |
| 4 | Shoulder-blade control: pull-aparts and holds with TAP® Exercise Bands; slow halos with a light TAP® Bell Club | 2 sets of 8–10 | 3 sets of 8–10 | Hold | 2 sets of 8 |
| 5 | Hip-to-shoulder sequencing drill with the Donley Hip Spin (optional) | Skip | Skip | Skip | 2 sets of 5 per side |
The Hip Spin waits until Weeks 7–8, when gym volume falls, so it does not add a new demand while the weighted-ball push enters.
Same Block, Two Athletes
The same eight weeks looks different for different pitchers. Step 1 sets the emphasis.
Pitcher A: limited hip rotation on the stride side. His rotational task is fine, but a mobility screen shows less hip range on one side. He spends more of the circuit on hip tasks, including on light days. The weighted push still starts in Week 5, and only if he moves well enough under load. If range does not improve, or he reports pain, the coach refers him to a qualified professional.
Pitcher B: flat rotational task. His movement is fine, but his medicine-ball scores barely change between tests. He spends more gym time on rotational power in Weeks 3–6, still within two sessions per week. The weighted push enters on the same schedule. A flat task is a reason to look at the training stimulus, not a diagnosis.
These illustrate how one named limitation changes the plan. They are not screening protocols.
Athlete and Parent Notes
For pitchers. Tell the staff when the radar number rises, and tell them what else changed: extra bullpens, lessons, long toss, showcases, sleep, soreness. Do not quietly add work because the number improved. A useful report sounds like this: “My readings are higher, but I added a lesson and an extra bullpen. My arm takes longer to feel normal the next morning.”
For parents. Ask a velocity program two questions. What happens to the athletes it does not help? What changes in the throwing plan when it does help? Agree on one shared record so school, travel-team, and private work do not disappear into separate calendars. Stop throwing when pain or fatigue develops, and seek qualified assessment for persistent, unusual, worsening, or function-limiting symptoms. This is a reporting and referral boundary, not rehabilitation or medical clearance.
Where This Guide Fits in the Series
This guide belongs to the Build cluster of How to Build a Fall Pitching Program. The cluster builds the capacity a pitcher will spend in the season. This guide owns one decision: how to organize a fall velocity block, and what to review when ball speed changes. It does not own workload prescription, lower-body diagnosis, deceleration programming, or full weighted-ball session design.
Before this guide: deceleration. Why Does Deceleration Matter? covered the force of stopping the arm after release and what a fall plan can build for it. Velocity and deceleration load the same arm, so plan the two together in one fall block.
After this guide: command. How Do Pitchers Improve Command? is next. Velocity matters, but a pitcher also has to get the ball over the plate consistently. A fall block that adds speed and ignores strike-throwing builds only half of what the season asks for.
Technical Appendix A: Study Findings and Evidence Limits
The article above is written for coaching use. This appendix records the study-level context and limits behind its main claims. A study finding applies first to the population, task, and duration actually studied.
Prospective injury evidence
Fleisig and colleagues followed 305 recently drafted professional pitchers from 2015 through 2019. Thirty-one underwent UCL surgery. Baseline elbow varus torque was associated with surgery, while laboratory and self-reported fastball velocity were not. The reported hazard ratio was 1.02 per newton-meter of baseline torque; the authors reported 1.26 (95% CI, 1.01–1.56) for a 10-newton-meter difference. The one-unit figure is rounded, so the 10-unit estimate should be taken from the authors rather than reconstructed from 1.02. Of 305 enrolled pitchers, 248 contributed usable full-effort biomechanical data; 28 of those underwent subsequent UCL surgery. Baseline torque means were 100.8 N·m in that group and 94.3 N·m in the group without subsequent surgery. The torque result was fragile: the confidence interval for the 10 newton-meter comparison nearly touched unity, normalized torque was not significant, and baseline measurements were not repeated. The study was also truncated by the pandemic and had substantial player attrition. Its useful contribution is the distinction between measured mechanical demand and a radar reading, not a screening threshold.
Zaremski and colleagues followed 71 high-school pitchers across five seasons and recorded 11 pitching injuries. Higher game velocity and a higher in-season-to-preseason velocity ratio were associated with injury. The small injury count prevented stable effect estimates and left workload analyses underpowered. Mastroianni and colleagues used a professional case-control design and found higher velocity associated with later UCL surgery. Prospective and case-control designs answer different questions; neither settles an individual rule.
Training evidence
Palmer et al. randomized 46 Division III baseball and softball athletes to dynamic power-stability or static endurance training for seven weeks. The power-stability group improved peak throwing velocity by about 3.4 mph; the endurance group did not improve peak velocity. Mean throwing velocity did improve in the endurance group, so the null should not be generalized to every velocity outcome. Both groups improved plank-type measures. Body-mass-normalized chop and lift power correlated with body-mass-normalized post-training peak throwing velocity at 0.70 and 0.73; prone and side-plank hold times correlated with that velocity outcome at 0.31 and 0.39. These were pooled post-training associations across 46 athletes, not proof that a change in one test caused a change in throwing speed. Only eight participants were male baseball pitchers, four in each group. The task was short-distance flat-ground throwing, not mound pitching.
Oyama, Palmer, and Laudner studied 54 high-school pitchers over eight weeks, comparing a lumbopelvic-hip training group with a control group. Ball speed and normalized elbow varus moment both increased in the training group. Changes in pitching kinematics did not differ between groups, and the authors recommended reducing pitch counts or extending rest as ball speed increases. The abstract does not report the size of the ball-speed gain or the correlation between ball speed and joint moments, so neither is given here. The study had no injury endpoint.
Escamilla et al. compared three six-week baseball-specific programs with an untrained control in high-school position players. The three training groups improved 1.2 to 2.0 percent; the control group did not improve. The study provides a control-group lesson, not a pitcher-specific fall protocol. Felion and DeBeliso’s small randomized high-school study found no throwing-velocity improvement from six weeks of core training, despite an improvement in bat exit velocity. Oyama and Palmer’s 2023 systematic review independently concluded that basic stabilization alone does not consistently improve throwing velocity, whereas more dynamic and demanding core work may. The adolescent subgroup of the Martínez-García meta-analysis returned a confidence interval from negative 0.18 to 1.17, which includes no effect.
Weighted-implement evidence
Fleisig and colleagues studied 25 pitchers (18 high-school, 7 collegiate; mean age 18.3, all with weighted-ball experience) throwing 4, 5, 6, and 7 oz balls from a mound. Positional differences were small, and measured kinetic values were lower at 7 oz. The study also included crow-hop conditions. It had no long toss, no longitudinal training, and no injury outcome. Its values are acute and were compared with a full-intent regulation throw. DeRenne and colleagues reported velocity gains in two ten-week programs covering roughly 255 pitchers (30 in 1990 and 225 in 1994, per a systematic review’s table), using balls near plus or minus 20 percent of a regulation ball. A later review found that the older under-60-feet-6-inches limitation did not apply to those studies. Caldwell and colleagues reviewed 10 studies, found velocity gains in most, rated the evidence quality very poor, and judged it inadequate to determine injury risk. Marsh and colleagues found no group-level velocity change in 17 older pitchers over six weeks, and a 2024 review found only three of nine weighted-ball studies outperformed controls. Reinold and colleagues randomized 38 pitchers and reported four elbow injuries in the training group and none in the control group. The velocity gain was within the training group; the difference between groups was not significant (P = 0.06), and the control group trained unsupervised. That protocol used 2 to 32 oz implements and running positions, did not isolate a cause, and was not powered to estimate injury risk. Dowling and colleagues, studying 21 high-school pitchers, found no significant difference in elbow varus torque between mound and flat-ground pitching at either distance, although ball velocity was higher from the mound. A 2011 comparison found maximum-distance throws produced the highest elbow and shoulder torques.
Workload and measurement evidence
Tabaracci, Sudhir, Gauthier, and Hannigan recorded preseason workload in nine Division I pitchers. Mean total throws were 1,990.6 with a standard deviation of 881.7 across six weeks. The study used throw count multiplied by median peak forearm angular velocity to describe daily workload. It was descriptive, small, and had no injury endpoint. It supports exposure accounting, not a safe total or ratio threshold.
Tremblay and colleagues studied 16 adolescent pitchers, average age about 17, in a fatigue crossover protocol. Pitch velocity declined over time, with no difference between the upper-body and lower-body fatigue conditions. The study supports a whole-body interpretation of a falling radar number. It does not identify injury risk or prove what happens in a competitive outing.
Mechanics, devices, and wearable resistance
McCutcheon, Slowik, and Fleisig analyzed 523 collegiate and professional pitchers. Eleven kinematic variables explained 40 percent of the variance in normalized elbow varus torque. The study is observational and cannot show that changing a listed variable will lower torque or improve safety for an individual pitcher.
Martin and colleagues conducted a qualitative study of collegiate pitchers and staff using wearable and portable biomechanical devices. Their work identifies perceived facilitators and barriers to adoption and interpretation. It does not test injury reduction or performance improvement.
Job, Cross, and Cronin tested a six-week, twice-weekly, volume-matched upper-arm wearable-resistance intervention in 17 collegiate pitchers. The wearable-resistance group did not show clear advantages in throwing performance or shoulder-rotator force; the control group gained more external-rotation range. Job, Cronin, Crotin, and Cross separately studied acute loading in 10 high-school and collegiate pitchers. Below-elbow loads reduced ball velocity and arm speed; above-elbow loads did not show the same clear effect. These results limit the studied protocols and placements.
What remains unknown
| Open question | Why it matters |
|---|---|
| How much should one pitcher reduce exposure after a velocity gain? | No study provides an athlete-specific adjustment or proves that a particular reduction lowers injury risk. |
| Do short training gains last into games or the next season? | Most interventions end at immediate post-testing. |
| Does dynamic rotational training change injury risk? | Training trials rarely report injury outcomes. |
| Do sensor-informed plans improve health or performance outcomes? | Collecting data is not the same as validating a coaching decision system. |
| Does a velocity change reliably predict one athlete’s elbow-torque change? | Individual relationships vary and ordinary coaching cannot directly measure joint kinetics. |
| Which blend of strength, throwing, recovery, and skill work fits a specific athlete? | Existing studies are too short, small, and heterogeneous to prescribe individual plans. |
Technical Appendix B: Terms and Measurement Limits
| Term | Meaning in this guide |
|---|---|
| Ball speed / pitch velocity | The speed of the ball, generally measured near release. It is an outcome of the full delivery, not a direct measure of tissue condition or readiness. |
| Elbow varus torque / valgus torque | Related conventions describing opposing rotational demands at the elbow. An external valgus demand opens the medial elbow; an internal varus moment resists it. A net joint moment estimated by inverse dynamics is not a direct measurement of force in the UCL. Retain the source’s convention, normalization, and units when comparing results. |
| Normalized measurement | A value scaled to a stated reference, such as body weight and height. The formula and units must accompany the value. Fleisig et al. divided torque by body weight and height and reported the result as a percentage. That normalized scale is not an absolute N·m quantity and is not necessarily the normalization used in another study. |
| Exposure | What the athlete was asked to do: total throws, high-intent throws, mound pitches, throwing days, density, and related activities. |
| Capacity | A quality the athlete has built, such as strength, rotational power, repeatability, or throwing tolerance. |
| Expression | What the athlete shows in performance, such as ball speed or command. |
| High-intent throw | A near-maximal or maximal-effort throw. The program should define and record it consistently. |
| Prospective cohort | A study that starts with athletes before an outcome and follows them forward. |
| Case-control study | A study that starts with athletes who already had an outcome and compares them with controls. It answers a different question from a prospective cohort. |
| Minimal detectable change | The smallest test change likely to exceed measurement noise. This review located no population-specific minimal detectable change for a rotational medicine-ball task. |
Appendix C: Velocity Development Record
For one athlete, one fall. This is a coaching record, not a medical screen, injury-prediction tool, or clearance document. The boundary remains the same: coaches ask, record, notice, monitor, adjust, coordinate, and refer.
| Step | Prompt | Coaching use |
|---|---|---|
| 1 | Age, height, and weight at the start and end of the block | Growth is a competing explanation for a velocity gain |
| 2 | Total summer and recent throwing exposure | Exposure is another competing explanation |
| 3 | Comparable velocity baseline across several outings | One reading is not a baseline |
| 4 | One rotational task at baseline | Track capacity separately from ball speed; this review located no population-specific minimal detectable change, so interpret small changes cautiously |
| 5 | Named limitation for the fall block | If there is no named problem, there is no focused plan |
| 6 | Training sessions, supervision, and main new demand | Document the actual dose |
| 7 | Weekly total throws and high-intent throws | Make hidden exposure visible |
| 8 | Weighted-ball push: dates, weights, and throw counts | Count every weighted throw as throwing exposure |
| 9 | Rotational task at week four and week eight | Look for a repeated trend across comparable sessions, not a few inches on one day |
| 10 | Comparable velocity trend | Compare the athlete with himself |
| 11 | Recovery between outings | A worsening pattern stops progression |
| 12 | What was held or reduced after velocity changed | Documents the exposure review |
| 13 | Next decision: hold, reduce, progress, coordinate, or refer | Keeps the plan adaptive rather than automatic |
Annotated Bibliography With Verified Source Links
Review levels: Full text reviewed means methods, results, and limitations were checked directly. Abstract reviewed means the published abstract and bibliographic record were reviewed; methods and tables were not independently checked. Bibliographic record reviewed means citation details were verified but no substantive result is used without confirmation elsewhere. Practitioner source reviewed means the cited material was read directly and is used as applied interpretation, not peer-reviewed proof.
Fleisig GS, Slowik JS, Wychgram C, D’Angelo J, Chalmers PN, Erickson BJ, Froom R, Pollack Porter KM, Curriero FC. Risk Factors for an Ulnar Collateral Ligament Injury Resulting in Surgery: A Prospective Longitudinal Study of 305 Professional Baseball Pitchers. Orthopaedic Journal of Sports Medicine. 2025;13(7):23259671251351339. https://doi.org/10.1177/23259671251351339
Review level: Full text reviewed. Why it matters: prospective professional study separating velocity from baseline elbow torque. Use with care: one baseline assessment, professional sample, attrition, and no individual threshold.
Zaremski JL, Pazik M, Vasilopoulos T, Horodyski M. Workload Risk Factors for Pitching-Related Injuries in High School Baseball Pitchers. American Journal of Sports Medicine. 2024;52(7):1685-1691. https://doi.org/10.1177/03635465241246559
Review level: Abstract reviewed. Why it matters: prospective high-school counterweight associating game velocity and a velocity ratio with injury. Use with care: 11 injuries and underpowered workload analysis.
Mastroianni MA, Kunes JA, Mueller JD, et al. Pitch-Specific Advanced Analytic and Pitch-Tracking Risk Factors for Ulnar Collateral Ligament Injuries in Major League Baseball Pitchers. American Journal of Sports Medicine. 2025;53(6):1440-1449. https://doi.org/10.1177/03635465251330564
Review level: Abstract reviewed. Why it matters: case-control counterweight associating higher pitch velocity with UCL surgery. Use with care: case-control design and no individual prediction rule.
Oyama S, Palmer T, Laudner K. Effects of an 8-Week Core Training Program on Lumbopelvic-Hip Muscle Function and Pitching Biomechanics in Adolescent Pitchers. Journal of Athletic Training. 2026;61(6):408-415. https://doi.org/10.4085/1062-6050-0674.25
Review level: Abstract reviewed in the November 2026 citation audit. Figures that appear only in earlier full-text notes (size of the ball-speed gain, correlations between speed and joint moments, task setup) could not be confirmed and were removed. Why it matters: high-school training study measuring ball-speed and normalized elbow-load changes. Use with care: allocation method not stated in the abstract, and no injury outcome.
Palmer TG, Uhl TL, Howell D, Hewett TE, Viele K, Mattacola CG. Sport-Specific Training Targeting the Proximal Segments and Throwing Velocity in Collegiate Throwing Athletes. Journal of Athletic Training. 2015;50(6):567-577. https://doi.org/10.4085/1062-6040-50.1.05
Review level: Full text reviewed. Why it matters: randomized comparison favoring dynamic power-stability work over static endurance for measured throwing velocity. Use with care: mixed baseball/softball sample and flat-ground outcome.
Oyama S, Palmer TG. Effectiveness of Core Exercise Training Programs Designed to Enhance Ball-Throwing Velocity in Overhead Athletes: A Systematic Review. Strength and Conditioning Journal. 2023;45(2):177-187. https://doi.org/10.1519/SSC.0000000000000738
Review level: Abstract reviewed. Why it matters: independent synthesis supporting the rotational and dynamic hierarchy over basic stabilization alone. Use with care: mixed overhead athletes and narrative review.
Escamilla RF, Ionno M, deMahy MS, Fleisig GS, Wilk KE, Yamashiro K, Mikla T, Paulos L, Andrews JR. Comparison of Three Baseball-Specific 6-Week Training Programs on Throwing Velocity in High School Baseball Players. Journal of Strength and Conditioning Research. 2012;26(7):1767-1781. https://doi.org/10.1519/JSC.0b013e3182578301
Review level: Full text reviewed. Why it matters: controlled six-week comparison with an untrained control. Use with care: high-school position players, not pitchers; no injury or mound-pitch outcome.
Felion CW, DeBeliso M. The Effects of Core Training on High School Baseball Performance. Athens Journal of Sports. 2020;7(3):173-188. https://doi.org/10.30958/ajspo.7-3-3
Review level: Full text reviewed. Why it matters: small randomized trial with no throwing-velocity improvement after core training. Use with care: small groups and baseline differences.
Martínez-García D, Chirosa Ríos LJ, Rodriguez-Perea A, Ulloa-Díaz D, Jerez-Mayorga D, Chirosa Ríos IJ. Strength Training for Throwing Velocity Enhancement in Overhead Throw: A Systematic Review and Meta-Analysis. International Journal of Sports Science and Coaching. 2021;16(5):1223-1235. https://doi.org/10.1177/17479541211002977
Review level: Abstract reviewed. Why it matters: adolescent subgroup estimate includes no effect. Use with care: mixed overhead sports, not pitcher-specific evidence.
Zhang HB, Jiang Q, Li A. The Impact of Resistance-Based Training Programs on Throwing Performance and Throwing-Related Injuries in Baseball Players: A Systematic Review. Heliyon. 2023;9(12):e22797. https://doi.org/10.1016/j.heliyon.2023.e22797
Review level: Full text reviewed. Why it matters: baseball resistance-training injury evidence is sparse. Use with care: heterogeneous samples and interventions.
Slowik JS, Aune KT, Diffendaffer AZ, Cain EL, Dugas JR, Fleisig GS. Fastball Velocity and Elbow-Varus Torque in Professional Baseball Pitchers. Journal of Athletic Training. 2019;54(3):296-301. https://doi.org/10.4085/1062-6050-558-17
Review level: Abstract reviewed. Why it matters: within- versus between-pitcher velocity–torque distinction. Use with care: professional laboratory sample.
Sakurai M, Barrack AJ, Lobb NJ, Wee CP, Diaz PR, Michener LA, Karduna AR. Collegiate Baseball Pitchers Demonstrate a Relationship Between Ball Velocity and Elbow Varus Torque, Both Within and Across Pitchers. Sports Biomechanics. 2024;23(12):3103-3111. https://doi.org/10.1080/14763141.2023.2205380
Review level: Abstract reviewed. Why it matters: collegiate evidence of individual variation in velocity–torque relationships. Use with care: association study; no threshold.
Tabaracci B, Sudhir S, Gauthier M, Hannigan L. Preseason Workload in Collegiate Baseball Pitchers. International Journal of Sports Physical Therapy. 2025;20(2):221-230. https://doi.org/10.26603/001c.128051
Review level: Full text reviewed. Why it matters: six-week preseason exposure accounting in nine Division I pitchers. Use with care: descriptive sample and no injury endpoint.
Tremblay M, Anderson Sirois S, Verville W, Auger M, Abboud J, Descarreaux M. Acute Upper-Body and Lower-Body Neuromuscular Fatigue Effect on Baseball Pitchers’ Velocity: A Pilot Study. Journal of Strength and Conditioning Research. 2024;38(8):1447-1452. https://pmc.ncbi.nlm.nih.gov/articles/PMC11286153/
Review level: Full text reviewed. Why it matters: velocity declined over time after both fatigue protocols in 16 adolescent pitchers. Use with care: laboratory fatigue experiment, not injury research.
Tremblay M, Tétreau C, Corbin-Berrigan L-A, Descarreaux M. Anthropometrics, athletic abilities and perceptual-cognitive skills associated with baseball pitching velocity in young athletes aged between 10 and 22 years old. Frontiers in Sports and Active Living. 2022;4:822454. https://doi.org/10.3389/fspor.2022.822454
Review level: Full text reviewed. Why it matters: the named source for the growth-and-maturity caution, identifying age, height and body mass among factors associated with pitching velocity in 170 athletes aged 10 to 22. Use with care: cross-sectional associations, mixed ages, and a different Tremblay study from the fatigue crossover above.
Reinold MM, Macrina LC, Fleisig GS, Aune K, Andrews JR. Effect of a 6-Week Weighted Baseball Throwing Program on Pitch Velocity, Pitching Arm Biomechanics, Passive Range of Motion, and Injury Rates. Sports Health. 2018;10(4):327-333. https://doi.org/10.1177/1941738118779909
Review level: Abstract reviewed. Why it matters: randomized weighted-ball trial of 38 pitchers aged 13 to 18 reporting four elbow injuries in the training group and none in the control group. The training group’s velocity gain (3.3%) was within-group; the between-group difference was not significant (P = 0.06). Use with care: small sample, four dropouts, unsupervised control group, not powered to establish injury risk, and a protocol (2 to 32 oz implements, kneeling, rocker, and run-and-gun throws, no mound) that does not test the 4-to-7 oz range.
Marsh JA, Wagshol MI, Boddy KJ, et al. Effects of a Six-Week Weighted-Implement Throwing Program on Baseball Pitching Velocity, Kinematics, Arm Stress, and Arm Range of Motion. PeerJ. 2018;6:e6003. https://doi.org/10.7717/peerj.6003
Review level: Full text reviewed. Why it matters: no group-level velocity change in older pitchers. Use with care: 17 pitchers, no control, commercial training context.
Fredriksen AB, van den Tillaar R. The Effect of Specific Strength Training on Throwing Velocity in Overarm Throwing: A Systematic Review. Sports Medicine - Open. 2024;10:122. https://doi.org/10.1186/s40798-024-00785-7
Review level: Full text reviewed. Why it matters: only three of nine over- and underweighted-ball studies outperformed controls. Use with care: mixed sports (12 of 17 included studies were handball, and the review’s sport counts do not sum to its total) and no pooled baseball-specific estimate.
Job TDW, Cross MR, Cronin JB. The Training Effects of Wearable Resistance on Throwing Performance in Collegiate Baseball Pitchers: A Pilot Study. International Journal of Sports Physiology and Performance. 2025. PMID: 40537114. https://pubmed.ncbi.nlm.nih.gov/40537114/
Review level: Abstract reviewed. Why it matters: six-week matched-volume collegiate wearable-resistance pilot. Use with care: 17 pitchers and no injury outcome; one range-of-motion outcome favored control.
Job TDW, Cronin JB, Crotin RL, Cross MR. Acute Effects of Wearable Resistance Applied to the Throwing Arm on Performance in Baseball Pitchers. Journal of Strength and Conditioning Research. 2025;39(3):340-346. https://openrepository.aut.ac.nz/items/d30d91b8-73fc-4371-846e-33dc3c215b7f
Review level: Full text reviewed. Why it matters: placement-specific acute effects in 10 high-school and collegiate pitchers. Use with care: single-session design.
Martin CL, Truong L, Evenson KR, Wolf J, Moore JB, Urban JE, Marshall SW, Shanley E, Nicholson K, Bullock GS. Perceptions of Biomechanical Devices in Collegiate Baseball Pitchers and Training Staff: A Qualitative Study. International Journal of Sports Physical Therapy. 2026;21(2):135-148. https://doi.org/10.26603/001c.155478
Review level: Full text reviewed. Why it matters: device adoption and interpretation barriers. Use with care: qualitative evidence, not outcome evidence.
McCutcheon TW, Slowik JS, Fleisig GS. Kinematic Parameters Associated With Elbow Varus Torque in Elite Adult Baseball Pitchers. Orthopaedic Journal of Sports Medicine. 2025;13(2):23259671241300560. https://doi.org/10.1177/23259671241300560
Review level: Abstract reviewed. Why it matters: 523-pitcher observational dataset; 11 variables explained 40 percent of normalized torque variance. Use with care: not a correction trial.
Wolforth R. Disappointing Results From Training? Texas Baseball Ranch. 2019. https://www.texasbaseballranch.com/blog/disappointing-results-from-training/
Review level: Practitioner source reviewed. Why it matters: published warning that fixed programs produce divergent individual responses. Use with care: commercial practitioner interpretation, not outcome research.
Wolforth J. Velocity Creation Is Formulaic. Texas Baseball Ranch. 2018. https://www.texasbaseballranch.com/blog/velocity-creation-is-formulaic/
Review level: Practitioner source reviewed. Why it matters: outlines a multi-factor framework rather than an implement-first model. Use with care: framework, not tested hierarchy.
Sullivan R. Impulse and the Little Glutes: The Most Important Contributors to Pitching Velocity. Florida Baseball ARMory. 2019. https://floridabaseballarmory.com/impulse-and-the-gms-pitching-velocity/
Review level: Practitioner source reviewed. Why it matters: applied force-and-timing framework. Use with care: proprietary, unpublished dataset and no outcome trial.
Sullivan R. The Truth About Hip-to-Shoulder Separation. Florida Baseball ARMory. February 12, 2025. https://floridabaseballarmory.com/the-truth-about-hip-to-shoulder-separation/
Review level: Practitioner source reviewed. Why it matters: argues against treating more separation as universally better. Use with care: practitioner explanation, not clinical or experimental proof.
Trunt A, Reed CA, MacFadden LN. Assessing the validity of an instrumented medicine ball for measuring throw speed. Sports Engineering. 2023;26:20. https://doi.org/10.1007/s12283-023-00413-9
Review level: Abstract, bibliographic record, and publisher disclosure reviewed in this update; subscription full text not accessed. Why it matters: distinguishes device validity from athlete-level reliability and meaningful change. Use with care: one participant, 156 throws, throw-dependent bias, and device-company-funded work; no pitcher-specific minimal detectable change or health endpoint.
MLB and USA Baseball. Pitch Smart: Guidelines for Youth and Adolescent Pitchers; Pitching Guidelines Ages 9–12. Accessed October 6, 2026. https://www.mlb.com/pitch-smart/pitching-guidelines ; https://www.mlb.com/pitch-smart/pitching-guidelines/ages-9-12
Review level: Official guidance reviewed. Why it matters: age-specific game-pitch limits, required rest, cross-team coordination, and planned annual throwing breaks. Use with care: practical guidance, not a validated individualized velocity-block protocol; apply the athlete’s age group and governing competition rules.
Nationwide Children’s Hospital. Let’s Play Ball: Throwing Guidelines for Young Players. Accessed October 6, 2026. https://www.nationwidechildrens.org/specialties/sports-medicine/sports-medicine-articles/play-ball
Review level: Institutional guidance reviewed. Why it matters: supports stopping throwing with fatigue, pain, or injury and early attention to shoulder and elbow pain. Use with care: clinical education rather than a training trial; this guide uses its stop-and-report boundary, not its older pitching tables or every mechanical recommendation.
Fleisig GS, Diffendaffer AZ, Aune KT, Ivey B, Laughlin WA. Biomechanical Analysis of Weighted-Ball Exercises for Baseball Pitchers. Sports Health. 2017;9(3):210-215. https://pmc.ncbi.nlm.nih.gov/articles/PMC5435148/
Review level: Full text reviewed in the November 2026 citation audit. Why it matters: acute mound biomechanics at 4, 5, 6, and 7 oz; elbow varus torque was lower at 7 oz and not significantly different at 4 or 6 oz. Use with care: 25 pitchers (18 high-school, 7 collegiate; mean age 18.3, all with weighted-ball experience), acute measures only, no training or injury outcome.
Okoroha KR, Meldau JE, Jildeh TR, Stephens JP, Moutzouros V, Makhni EC. Impact of Ball Weight on Medial Elbow Torque in Youth Baseball Pitchers. Journal of Shoulder and Elbow Surgery. 2019;28(8):1484-1489. https://doi.org/10.1016/j.jse.2019.01.025
Review level: Abstract and bibliographic record reviewed. Why it matters: in 19 pitchers aged 9 to 14 (mean 11.8) throwing 3, 4, 5, and 6 oz balls from ground level, medial elbow torque rose about 0.92 N·m per added ounce, the opposite of the older-adolescent and collegiate mound pattern. Use with care: small sample, five throws per ball, and no mound or injury outcome.
DeRenne C, Ho KW, Blitzblau A. Effects of Weighted Implement Training on Throwing Velocity. Journal of Applied Sport Science Research. 1990;4(1):16-19. https://latech.elsevierpure.com/en/publications/effects-of-baseball-weighted-implement-training-a-brief-review
Review level: Bibliographic record and a citing systematic review’s table reviewed (30 pitchers, ten weeks, velocity gain); original not read. Why it matters: older training study near the 4-to-6 oz band. Use with care: older, small study; the journal was later renamed Journal of Strength and Conditioning Research.
DeRenne C, Buxton BP, Hetzler RK, Ho KW. Effects of Under- and Overweighted Implement Training on Pitching Velocity. Journal of Strength and Conditioning Research. 1994;8:247-250. https://latech.elsevierpure.com/en/publications/effects-of-baseball-weighted-implement-training-a-brief-review
Review level: Bibliographic record and the DeRenne and Szymanski review reviewed (225 pitchers, 45 high-school and 180 college, ten weeks, velocity gain, no related throwing injuries reported); original not read. Why it matters: larger older training study near the 4-to-6 oz band. Use with care: older design, and later reviews rate the weighted-ball literature very poor in quality.
DeRenne C, Szymanski DJ. Effects of Baseball Weighted Implement Training: A Brief Review. Strength and Conditioning Journal. 2009;31:30-37. https://latech.elsevierpure.com/en/publications/effects-of-baseball-weighted-implement-training-a-brief-review
Review level: Verified in the Oates 4-to-7 Ounce Range article; not re-read for this guide. Why it matters: source for the plus-or-minus-20 percent convention, the 2:1 altered-to-standard convention, and the distance caveat. Use with care: does not state whether the 2:1 ratio counts throws or sessions.
Caldwell JE, Alexander FJ, Ahmad CS. Weighted-Ball Velocity Enhancement Programs for Baseball Pitchers: A Systematic Review. Orthopaedic Journal of Sports Medicine. 2019;7(2):2325967118825469. https://pmc.ncbi.nlm.nih.gov/articles/PMC6378453/
Review level: Verified in the Oates 4-to-7 Ounce Range article; not re-read for this guide. Why it matters: 10 studies; most reported velocity gains, but the authors rated the evidence quality very poor and found it inadequate to judge injury risk. Use with care: marked heterogeneity in protocols, ball weights, and populations.
Dowling B, McElheny KD, Camp CL, Ling DI, Dines JS. Effects of Mound Versus Flat-Ground Pitching and Distance on Arm Mechanics and Elbow Torque in High School Pitchers. Orthopaedic Journal of Sports Medicine. 2020;8(12):2325967120969245. https://journals.sagepub.com/doi/10.1177/2325967120969245
Review level: Full text reviewed in the November 2026 citation audit. Why it matters: in 21 high-school pitchers, elbow varus torque did not differ between mound and flat ground at 60.5 or 50.5 ft; the only torque difference was lower on the mound at 60.5 than at 50.5 ft. Ball velocity was higher from the mound. Use with care: descriptive laboratory study with five fastballs per condition.
Fleisig GS, Bolt B, Fortenbaugh D, Wilk KE, Andrews JR. Biomechanical Comparison of Baseball Pitching and Long-Toss: Implications for Training and Rehabilitation. Journal of Orthopaedic & Sports Physical Therapy. 2011;41(5):296-303. https://pubmed.ncbi.nlm.nih.gov/21212502/
Review level: Verified in the Oates 4-to-7 Ounce Range article; not re-read for this guide. Why it matters: maximum-distance throws produced the highest elbow and shoulder torques. Use with care: 17 collegiate pitchers.
Wolforth R. Wolforth Throwing Mentorship, Article 30: 10 Reasons Why You Are Stuck on Your Velocity. Perfect Game. May 17, 2023. https://www.perfectgame.org/articles/view.aspx?article=21925
Review level: Practitioner source reviewed. Page text was read through a web fetch; the PT assessment form and any media were not seen. Why it matters: source for the heavy, medium, and light weekly pattern and the listed habits. Use with care: self-assessment checklist, no data or methodology, and the author runs a commercial program with a working relationship with Oates Specialties.
About This Analysis
Created by the Oates Specialties team led by Robert Oates, M.Ed., Founder
Editorial oversight by Gunnar Thompson, BS, CSCS, General Manager
Certified Strength & Conditioning Specialist | Biomechanics Specialist
November 2026
Complete Credentials
ROBERT OATES, M.Ed., Founder: Founded Oates Specialties in 2003. Master of Education degree. Provides strategic direction for educational content and athlete development philosophy.
GUNNAR THOMPSON, General Manager: BS Kinesiology (Clinical Exercise Science). CSCS (NSCA), PES (NASM), CPPS certifications. Technical authority on biomechanics and performance science. Conducts review of all educational content for scientific accuracy.
Questions or corrections: gunnart@oatesspecialties.com
© 2026, Oates Specialties LLC